Explore Accurate Methods for Testing the Purity of Precious Metal Jewelry
A Guidebook to Testing Precious Metal content of Jewelry

Table of Contents
Section ⅠPrinciples of Testing the Purity of Precious Metal Jewelry
Testing the purity of precious metal jewelry has existed since ancient times. Our ancestors primarily relied on their sensory perceptions and existing experiences to conduct tests to determine the purity of precious metal jewelry. For example, they would observe its color with their eyes, weigh it with their hands, and test its hardness by biting it. Of course, there is also a specific scientific rationale behind this. However, with the development of science and technology, the continuous invention and updating of scientific testing instruments have introduced some modern scientific testing tools into precious metal jewelry purity testing, especially in commercial testing.
Modern testing technology for the purity of precious metal jewelry is based on scientific instruments characterized by accuracy, short testing time, low cost, and ease of operation. It is developing towards faster, simpler, and more accurate methods. With the continuous advancement of science and technology, the testing techniques and methods for the purity of precious metal jewelry will become more refined.
In testing the purity of precious metal jewelry, the following three principles must generally be followed.
(1) Non-destructive testing should be achieved as much as possible. Therefore, when selecting testing methods, one should choose methods that do not damage the appearance of the precious metal jewelry. If it is truly unavoidable, consent or authorization from the client must be obtained.
(2) The detection should maintain a certain level of accuracy. In other words, the detection accuracy should be within the corresponding standard range.
(3) The detection cost should be as low as possible.
The specific objectives for detecting the quality of precious metal jewelry mainly include two aspects: the first is to identify the authenticity of precious metal jewelry; the second is to determine the quality of precious metal jewelry.
Section II Common Simple Detection Methods for Precious Metal Jewelry Quality
Since ancient times, people have explored a complete set of experiential methods for identifying the quality and authenticity of precious metals based on their characteristics. Correctly utilizing these methods can effectively, quickly, and qualitatively identify the authenticity and quality of precious metal jewelry.
1. Observing Color Method
Ancient people recognized that there is a certain correspondence between the color of gold and its content. There is a saying in folklore: “Four sevens are not gold.” “Seven green” refers to a gold content of 70% and silver content 30%, where gold appears greenish-yellow; “Eight yellow” refers to gold content 80% and silver content 20%, where gold appears golden yellow; “Nine purple” refers to gold content 90% and silver content 10%, where gold appears purplish-yellow; “Ten red” refers to gold content close to 100% and extremely low silver content, which is red gold, fine gold, or pure gold, where gold appears reddish-yellow. This traditional method of summarizing experience is only effective for judging silver-containing clear gold.
There is a slight reddish hue above the golden yellow for pure gold, fine gold, red gold, pure red gold, 999 gold, and 24K gold. The color referred to as “red gold” or “fine gold” in folklore is this color of pure gold. For K gold 22 K, 18 K, 14 K, 10 K, 9K, 8K, the color of gold jewelry reflects the types and proportions of impurities in the gold. Generally speaking, the color of the silver-containing clear gold series tends to be yellow, while the color of the copper-containing mixed gold series tends to be red.
Judging the quality of gold based on the displayed color can only be a qualitative description. With modern science and technology development, gold of different qualities can display the same color, as we have introduced earlier. Using this method to determine the quality of natural gold has some rationale.
In traditional craftsmanship jewelry, fake silver jewelry often uses aluminum or aluminum alloys, white copper, tin, or tin alloys, which usually have a dull gray color and poor luster; low-silver jewelry has a slightly yellow or gray color and poor refinement; high-silver jewelry is bright, pure white, and has better luster. Generally speaking, when the jewelry is an alloy of silver and copper, 85 silver appears slightly reddish, 75 silver appears reddish-yellow, 60 silver appears red, and 50 silver appears black; when the jewelry is an alloy of silver and white copper, 80 silver appears grayish-white, and 50 silver appears black-gray; when the jewelry is an alloy of silver and brass, the lower the silver content, the yellower the jewelry color. Generally, pure white and finely crafted jewelry has a quality of over 90%. In comparison, white jewelry with gray and red and rough workmanship has a quality of around 80%, and gray-black or light yellow-red jewelry usually has a quality below 60%. It should be noted that modern craftsmanship imitation silver or low-silver jewelry, when surface plated with silver or rhodium, can have colors, precision, and surface luster indistinguishable from genuine silver jewelry, making it impossible to visually assess the quality of the jewelry.
The quality of platinum and the composition of alloy elements differ, resulting in different displayed colors: Higher-quality platinum presents a bluish-white with a slightly gray color. Platinum containing a certain amount of Cu or Au appears bluish-white with a slight yellow color. Platinum with a higher amount of Ag appears silver-white. Palladium jewelry generally presents a steel-white color with good metallic luster. Imitation platinum or palladium jewelry is often made from white copper, nickel alloys, sodium alloys, etc., which are prone to oxidation and dullness.
2. Touchstone Testing Method
The touchstone method is the oldest tool and method for identifying the authenticity and quality of gold and silver, with records of its use in ancient civilizations around the world. It involves scratching the tested jewelry and a gold standard (a set of gold plates with a determined quality, referred to as the standard) on the touchstone. By comparing the color of the scratches left on the touchstone, one can determine the authenticity and quality of the jewelry. This testing method has long been considered a relatively accurate, reliable, and quick detection method. Even today, many gold and silver recycling shops still frequently use this method to quickly identify materials, which can detect both the quality of gold jewelry and the quality of silver jewelry.
Traditional touchstones are mostly black or gray stones, generally made of black flint or siliceous slate, with a Mohs hardness of about 6.5 and a fine texture. Dark siliceous rock pebbles near the ancient gold and copper site in Xinjiang, China, dark siliceous rocks known as “desert lacquer” on the Gobi Desert, and black rain flower stones from Nanjing can all be processed into excellent touchstones after grinding. The gold test plate is a slender small plate made of gold with different standard purities, engraved with the standard purity of the gold plate on one end, which has a small hole drilled through it for threading into groups, usually consisting of multiple pieces, as shown in Figure 6-1. The finer the gold test plate classification, the wider the range of colors covered, and the more accurate the analysis results.

The touchstone method for testing the purity of gold jewelry is a colorimetric method. The method is as follows:
(1) Prepare the touchstone.
Wash the working surface of the test stone with water, rinse it, and blow it dry. On the stone surface with castor oil coated to form the oil channel, long to the ends of the test stone, the width of 20 mm is appropriate, after oiling with a clean silk cloth to wipe off the floating oil so that the oil channel to maintain a very thin layer. When the oil layer is too thick, it is easy to roll oil and black, but if it is too dry, it is not easy to color. The edge of the oil channel should be straight, flush, parallel to the edge of the test stone, and with no oil part of the formation of a clear distinction to maintain the grinding of the same length of the gold channel. Pay attention to the fingers. Do not touch the stone surface; avoid the surface stained with dust and moisture, especially in the mouth gas and sweat in the hands. Otherwise, it takes work to color.
(2) Grinding method.
When using a touchstone for grinding, generally hold the stone with the left hand and the gold with the right hand, with the thumb on top and the other fingers below. The oiled side should be on top, and the touchstone should be held firmly in hand and stabilized on the table without movement. During grinding, the item to be tested or the test plate should be pressed tightly against the stone surface, and the right hand holding the gold should use wrist strength. The grinding path is generally 20-30 mm long and 3-5 mm wide. The gold piece path and the test plate path should be consistent in length and width, and the test plate path can be ground on both sides of the gold piece path for color comparison. If the color of the gold piece path is inconsistent with the test plate path, select another test plate to grind and observe the color until the two paths match.
(3) Identification
When gold is scratched on the touchstone, it leaves a colored mark. Over a long period of practice, people have summarized a set of experiences for identifying the authenticity and quality of gold using the touchstone, known as “look at the color flat, look at the light at an angle, listen closely to the sound.” Pure gold containing silver is soft, and the gold path appears bluish without floating color, focusing mainly on “looking at the color flat” and secondarily on “looking at the floating color at an angle.” For mixed gold containing silver and copper, there is sound and floating light during grinding, focusing mainly on “looking at the floating color at an angle” and secondarily on “looking at the color flat.” Using acid to erode the gold path can enhance color differences and highlight distinguishing features. The acid used should preferentially react with the base metals and silver in the precious metal materials. Depending on the alloy quality, the acids used can include nitric acid, a mixture of nitric acid and salt, or a mixture of nitric acid and hydrochloric acid, etc.
The touchstone method for testing the quality of gold jewelry is determined by visual observation and comparison, requiring rich practical experience and being influenced by many human factors, resulting in limited accuracy. Additionally, as the types of gold jewelry increase and their compositions become more complex, and with a limited number of gold brother cards, it becomes difficult to distinguish between gold-plated or gold-coated items. With the continuous development of non-destructive testing technology for gold, the touchstone method has gradually been replaced by other more convenient, simple, and precise methods.
3. Weighing method
Gold has a high density, with pure gold having a 19.32 g/cm3 density. When weighed by hand, it feels heavy and has a noticeable weighty sensation. Since the density of gold is much greater than that of metals such as lead, silver, copper, tin, iron, and zinc, whether it is brass (with a density of 8.9 g/cm3), copper-based alloys, or imitation gold materials such as rare gold, sub-gold, imitation gold, etc., or gold-plated items, gold-plated items such as gold and gold-filled jewelry do not have the heavy feeling of pure gold when weighed by hand. The weighing method is most effective for distinguishing 24K gold. Still, it could be more effective for identifying gold-plated or gold-filled products made of tungsten alloy, which has a density similar to gold, because it is difficult to feel the difference between the two by hand.
The density of platinum is 21.45 g/cm3, and the mass of the same volume of platinum is more than twice that of silver (with a density of 10.49 g/cm3). It is also denser than gold, making it heavy when hand-weighted. Therefore, when using the weighing method to distinguish between platinum, gold, and silver jewelry, there is a saying: “The heavy one is platinum or gold, the light one is silver or brass.”
Since there is also a significant difference in density between silver and aluminum and stainless steel, the weighing method can also be used to distinguish them, saying: “Aluminum is light, silver is heavy, copper and steel products are neither light nor heavy.”
4. Ductility Method
The ease of bending jewelry can also indirectly indicate the purity of gold jewelry and the type of precious metal material. Pure gold has excellent flexibility, a comprehensive manifestation of gold’s high toughness and low hardness. Silver is next, platinum is harder than silver, and copper has the highest hardness. Gold-silver alloys are slightly harder, and gold-copper alloys are even harder; the lower the gold content in the alloy, the higher the hardness. For example, pure gold jewelry feels very soft when gently bent at its opening or clasp, while imitation gold materials do not have this feeling. Therefore, pure gold is easy to bend and break, while lower-purity gold jewelry is not easy to bend and is prone to breaking.
When using this method to test gold and silver jewelry, special attention should be paid to the impact of the width and thickness of the jewelry on its flexibility. Generally, wider and thicker jewelry feels harder when bent; conversely, narrower and thinner jewelry feels softer.
5. Hardness Test Method
The hardness of precious metal jewelry is closely related to its gold content; the higher the purity, the lower the hardness. Pure gold has a very low hardness; a common method is to bite it with teeth. Since teeth’ hardness is greater than gold, bite marks can be left on gold, indicating that it is high-purity gold. In contrast, imitation gold materials have a higher hardness, making it difficult to leave bite marks. During testing, a hard copper needle is usually used to gently scratch the back or inconspicuous area of the jewelry; the deeper the scratch left, the higher the gold content, and vice versa if the scratch is not obvious or shallow. It is important to note that in commercial testing, using this method to test the purity of precious metal jewelry is considered destructive testing and should be done with the consent or authorization of the client.
Pure silver also has a low hardness and can be scratched with a fingernail. If the jewelry is soft and not tough, it may contain tin or lead; if it is hard and not tough, it may be made of copper (nickel silver), iron, or other alloys.
6. Fire Test Method
As the saying goes, “Real gold fears no fire,” and “Intense fire reveals true gold.” Gold has a high melting point (1063℃) and can remain non-melting, unoxidized, and unchanged in color at high temperatures (below the melting point). Even if the temperature exceeds the melting point and gold begins to melt, it still maintains its color. In contrast, low-karat gold and imitation gold materials will change color, even turning black, when burned red hot and cooled.
The melting point of platinum (1773℃) is higher than that of gold. After being burned and cooled, its color remains unchanged, while silver turns milky white, reddish, or blackish-red after being burned and cooled, depending on the silver content.
7. The method of listening to sound and tone
Due to the low hardness of gold, silver, and platinum, when solid gold or high-karat gold jewelry is thrown into the air, its sound upon landing is dull, without noise or bounce. When the jewelry falls on a hard cement floor, high-karat gold or platinum jewelry will produce a dull sound with little elasticity; lower-karat jewelry, copper, or stainless steel products will emit a sharp and loud tone with high bounce. Traditional pure gold has sound but no tone and little bounce, while mixed gold has sound, tone, and bounce, with greater bounce and sharper, longer tones indicating lower purity. However, with advancements in gold jewelry manufacturing technology, many high-strength hardened solid gold products have emerged in the current market, meeting the standards of 999 gold and possessing good elasticity.
The density of platinum is higher than that of gold, and the sound characteristics of platinum when thrown into the air and falling to the ground are similar to those of gold, which can be used to distinguish imitation platinum, platinum-plated, and platinum-coated jewelry.
Similarly, sterling silver and high-purity silver jewelry have a high density and soft texture, resulting in a low rebound height when dropped on a surface. In contrast, fake silver or low-purity silver jewelry has a relatively higher rebound height due to its low density and hardness.
8. The marking method
Gold jewelry must be stamped according to international standards to indicate its purity. In our country, 24K gold is marked with “pure,” “fine gold,” “red gold,” or ” 24K,” and 18K gold is marked with ” 18K ” or “750,” among other labels.
In our country, the purity of silver is represented by a thousandth, percentage, or fraction followed by the character “s” (silver), such as “800s”, “80s”, and “80% S”, all indicating a silver purity of 80%; internationally, it is usually represented by a thousandth followed by “S” or “Silver,” such as “800 S” and “800 Silver”, both indicating a silver purity of 80%. There is also a silver-plated material seal, commonly represented internationally by “SF” (the initial letters of silver fill).
Internationally, platinum purity and quality are indicated by a thousandth number followed by “Pt,” “Plat,” or “Platinum,” such as 950Pt indicating a platinum purity of 95%; in the United States, it is marked only with “Pt” or “Plat,” which guarantees that the platinum purity is above 95%.
Section III Hydrostatic Method (Density Method)
1. Detection Principle
The density of pure gold is 19.32 g/cm3. If the density of a certain precious metal ornament is measured to be lower than this value, it can be confirmed that other metals are mixed in. The size of the density is closely related to the purity of gold. The purity of gold can be inferred from the density, which is the basic principle of using the density method to test the purity of precious metal jewelry.
The volume of the jewelry is equal to the sum of the volume of pure gold in the jewelry and the volume of the impurity metals, which is:
V = Vpure + Vimpurities (6-1)
In the formula:
V-volume of the accessory (mL);
Vpure-The volume of pure gold in the jewelry is (mL)
Vimpurities -The volume of impurities in the jewelry is (mL)
Using a 1/10000 analytical balance for accurate weighing, the mass of the gold jewelry is m; then, using a fine thread to secure the jewelry, its mass in water is accurately measured as m’ (the mass of the thread should be deducted if necessary). According to Archimedes’ principle, the buoyant force acting on an object in water is equal to the mass of the water it displaces, that is:
m – m’ = V x ρ water (6-2)
The usual density of water is 1 g/cm3 , resulting in: m – m’ = V, Substituting equation (6-1) yields:
m – m’ = Vpure + V impurities
According to the relationship between the volume and mass of the object V = m/ρ, it follows that:

Simplifying the above equation and substituting the pure gold density ρ pure =19.32 g/cm3 to convert it into mass fraction, we get:

In the formula:
m – jewelry quality (g);
m’ – the quality of jewelry in water (g);
m pure – the quality of pure gold in the jewelry (g);
ρ impurities – the density of impurities in the jewelry (g/cm3)
2. The method of taking the value of ρ impurities
The above formula is used to detect the content of gold in gold jewelry, and the actual weighing of the analytical balance obtains it. The value of impurities remains to be determined. According to the experience of gold jewelry in the main impurities for Ag and Cu, impurities density is determined by the relative content of impurities in Ag and Cu. Among them, the density of Ag is 10.49 g/cm3, and the density of Cu is 8.90 g/cm3, so the value of impurities ranges between 8.90 ~ 10.49/cm3. The values of impurities are as follows:
For gold – silver series alloys (clear gold): ρ impurities = ρ silver = 10.49 g/cm3
For gold – copper series alloys (mixed gold): ρ impurities = ρ copper = 8.90 g/cm3
For gold – silver – copper series alloys (mixed gold): ρ impurities =1/(x/ρ silver + y/ρ copper), x+y = 1
If x = y =0.5 , then ρ impurities =9.63 g/cm3
If x:y = 1 : 2 , then x = 0.3333, y = 0.6666, ρ impurities = 9.375
If x:y = 2 : 1 , then x = 0.6666, y = 0.3333, ρ impurities = 9.901
The above analysis shows that the density of gold alloy and the density of different types and proportions of impurity metals are the main factors for accurately calculating the quality of gold jewelry. Only when the types and proportions of impurity metals in the sample being tested are known in advance can the quality of the sample be calculated using the density method, which is also a necessary condition for density testing.
It should be noted that the hydrostatic method can more accurately determine the gold content of pure gold jewelry. Alternatively, when the elemental ratios of the alloy components are known, the gold content in the jewelry can be calculated based on the detected density value of the jewelry. However, when the component ratios of the alloy are unknown, it is usually impossible to calculate the gold content in the jewelry based on the detected density value. Therefore, when the alloy components are uncertain, there is no one-to-one correspondence between the gold content of the jewelry and the density value.
3. Characteristics of Density Method Detection
The density method tests the density of jewelry using Archimedes’ principle, calculating the quality content based on the density of gold-silver-copper alloys as a function of gold content. This method has advantages such as convenience, speed, non-destructive sampling, minimal equipment, and ease of operation. It effectively distinguishes the authenticity of gold jewelry, such as determining whether it is gold or gold-plated and measuring the gold content of pure gold jewelry. Inspection accuracy is relatively high for seamless stamped jewelry, such as rings and whip chains. However, it cannot test hollow jewelry. It cannot distinguish high-density impurities, such as tungsten, which has a density of 19.35 g/cm3, very close to that of pure gold, making it difficult to measure using this method. The error in testing the quality of K gold jewelry is significant, especially when there are sand holes and welding holes inside the jewelry, gaps on the surface where the working liquid cannot penetrate, or impurities other than gold and silver, which can lead to errors in the detection results.
4. Detection Methods
4.1 Double Pan Balance Method
4.1.1 Testing Instruments
A balance with a sensitivity of 0.1mg, immersion liquid, a small table, and fine copper wire (hair can be used as a substitute).
(1) Balance. You can choose a mechanical or electronic balance with a sensitivity of 0.1mg.
(2) Immersion liquid. You can choose anhydrous ethanol, carbon tetrachloride, xylene, water, or ethanol mixed with water contained in a 50mL glass beaker.
(3) Small table. A small table made of a metal plate, according to the balance model, can be placed above the weighing pan without affecting the up-and-down movement of the pan.
(4) Fine copper wire. Cut several pieces of fine copper wire of equal length (Φ=0.2 mm), weigh them with the balance, and select two segments from each group with equal total mass, dividing them into two groups. Roll one end of the two small segments of one group into small hooks and twist the other ends together so both small hooks can hang simultaneously on the weighing pan [Figure 6-2(a)], one end can be hooked onto the sample holder, while the other end is immersed in the solution [Figure 6-2(b)]; another group can be placed directly on the weight pan. If using hair, all details and processing steps of the fine copper wire can be omitted, and a small loop can be made with the hair tied to the gold jewelry, hanging it on the middle hook of the sample holder.

4.1.2 Operating Steps
(1) Check the balance of zero points. Remove the fine copper wire, determine the balance zero point, adjust the screw so that the sensitivity is no greater than 0.0001g, then hang the fine copper wire on both sides and adjust the balance zero point so that the pointer aligns with the “0” position; if using hair, this step of adjusting the balance zero point after hanging the copper wire can be omitted.
(2) Determine the temperature correction curve. The density of the immersion solution varies at different temperatures. Table 6-1 lists ethanol, xylene, and carbon tetrachloride densities at different temperatures. In practice, the purity of the organic solution, the introduction of impurities later, and the temperature difference between the thermometer and the temperature of the immersion solution beaker can all cause the measured results to deviate from the data in Table 6-1, with some even differing significantly.
Table 6-1 Densities of Ethanol, Xylene, and Carbon Tetrachloride Immersion Solutions at Different Temperatures
| Infusion | |||||
|---|---|---|---|---|---|
| Ethanol | Ethanol | Xylene | Xylene | Carbon tetrachloride | Carbon tetrachloride |
| Density /(g/cm3) | Temperature /℃ | Density / (g/cm3) | Temperature /℃ | Density /(g/cm3) | Temperature /℃ |
| 0.837 | 7 | 0.839 | 6 | 1.630 | 3 |
| 0.830 | 16 | 0.829 | 16 | 1.610 | 13 |
| 0.829 | 18 | 0.824 | 22 | 1.599 | 18 |
| 0.827 | 19 | 0.819 | 27 | 1.589 | 23 |
| 0.821 | 21 | 0.814 | 32 | 1.579 | 28 |
| 0.817 | 26 | 0.809 | 37 | 1.569 | 33 |
| 0.810 | 32 | 0.804 | 42 | 1.559 | 38 |
(3) Clean the precious metal jewelry thoroughly and wipe it with anhydrous ethanol or acetone until dry.
(4) Hang the gold jewelry on the middle hook of the weighing pan with fine copper wire or hair, and weigh the mass of the precious metal jewelry m.
(5) Immerse the precious metal jewelry in the immersion liquid beaker and weigh the mass of the gold jewelry in the immersion liquid m.
(6) Calculate the density of the precious metal jewelry ρ gold =m/(m-m’) x relative to the density of the immersion liquid.
(7) Convert to the fineness of the precious metal (gold or silver) based on the density and assumed end-member metals.
4.1.3 Notes
(1) Precious metal jewelry must be clean and dry; otherwise, the error will be significant.
(2) The working curve must be calibrated regularly; it cannot be a one-time fix.
(3) When precious metal jewelry is immersed in the solution, do not weigh it immediately; shake it for a while and visually check for any bubbles. If there are any visible small bubbles, they must be removed.
(4) Ethanol, xylene, and carbon tetrachloride are all volatile; measurements must be quick and stable, and be careful not to spill them on the balance. After the measurement, cover it with a special lid or pour it into a dedicated bottle; do not pour it back into the original container.
(5) If there is a situation where the density exceeds that of gold, calibration must be performed.
(6) The name, quality, shape, surface structure, and color of precious metal jewelry should be recorded, especially the color and surface. The structure is very important, as it can prevent discrepancies in the quality of tungsten-containing jewelry. Keeping the original data allows for the analysis of detection errors, which is beneficial for quality management.
4.2 Single-pan electronic balance method
4.2.1 Instrument
An electronic single-pan balance with a sensitivity of 0.0001g, immersion liquid, and suspension rack.
(1) Electronic balance. Single pan, sensitivity of 0.0001g or more sensitive, digital display.
(2) Immersion liquid. Similar to the double pan method, since there is no balance hanger, a slightly larger beaker can be used for holding.
(3) Suspension frame. It can be made larger, fixed outside the weighing pan without affecting the up and down movement of the weighing pan, with a height that is 1.5 ~ 2 times that of the immersion liquid beaker; it is also possible to weigh in the air by placing it on the weighing pan, holding it by hand in the immersion liquid, or making a hook on the balance cover to hang the sample on the balance cover.
4.2.2 Operating steps
(1) Check the balance zero point; refer to the electronic balance user manual for inspection.
(2) Determine the temperature correction curve using the double pan method.
(3) Wash and dry precious metal jewelry using the double pan method.
(4) Place the immersion liquid beaker on the weighing pan, install the suspension frame, pour in the immersion liquid, and adjust the balance to zero.
(5) Place the precious metal jewelry on the weighing pan, read the mass of the precious metal jewelry m, and record it.
(6) Hang the precious metal jewelry on the suspension frame with hair, immerse it in the immersion liquid, directly read the mass difference of the precious metal jewelry in air and the immersion liquid (m-m’), and record it.
(7) Calculate the density of precious metal jewelry using the double pan method.
(8) Convert the fineness of precious metal jewelry using the double pan method.
4.2.3 Notes
(1) The single pan method does not have a table pad, and the volatility of the immersion liquid significantly affects accuracy. Therefore, the time between zeroing and measuring the mass must be short, and measurements should be quick and stable, especially in summer, when the time interval between two measurements should be minimized.
(2) The sample pan must be centered, and the immersion liquid beaker should be placed in the center; otherwise, it will affect the measurement results.
(3) The sensitivity of the electronic balance must be checked, and the digital display system should also be verified with known standards.
(4) Be careful when pouring the liquid, and do not spill it on the surface of the electronic balance.
Section IV X-ray Fluorescence Analysis Method (XRF Method)
X-ray fluorescence spectroscopy (XRF) is an effective analytical method widely used in metallurgy, mining, petroleum, environmental protection, medicine, geology, archaeology, criminal investigation, grain and oil, finance, and other sectors. The X-ray fluorescence spectroscopy method for precious metals is one of the testing methods recommended by international financial organizations.
1. Basic Principles of X-ray Fluorescence Analysis
The electron probe determines the wavelength (or energy) and intensity of the characteristic X-ray spectral lines emitted after the sample is excited. X-ray fluorescence analysis is similar to this, but unlike the electron probe, the incident light is X-rays. The irradiated sample absorbs the primary X-rays and is excited to emit secondary X-rays. Various secondary X-rays are referred to as X-ray fluorescence, and by measuring the wavelength (or energy) and intensity of these characteristic spectral lines, the content of elements can be determined.
2. Structure of X-ray fluorescence spectrometer
In 1948, Friedman (H. Friedman) and Birks (L. S. Birks) created the world’s first commercial X-ray fluorescence spectrometer. For decades, the technology of X-ray fluorescence spectrometers has developed rapidly, with new models characterized by speed, flexibility, and precision continuously emerging. X-ray fluorescence spectrometers are divided into two main categories: wavelength-dispersive X-ray fluorescence spectrometers and energy-dispersive X-ray fluorescence spectrometers. The former can be further divided into sequential and simultaneous types.
2.1 Sequential wavelength-dispersive X-ray fluorescence spectrometer
The sequential wavelength dispersive X-ray fluorescence spectrometer mainly consists of an X-ray tube, a spectroscopic system, a detection system, and a recording system. The structure of the instrument is shown in Figure 6-3.
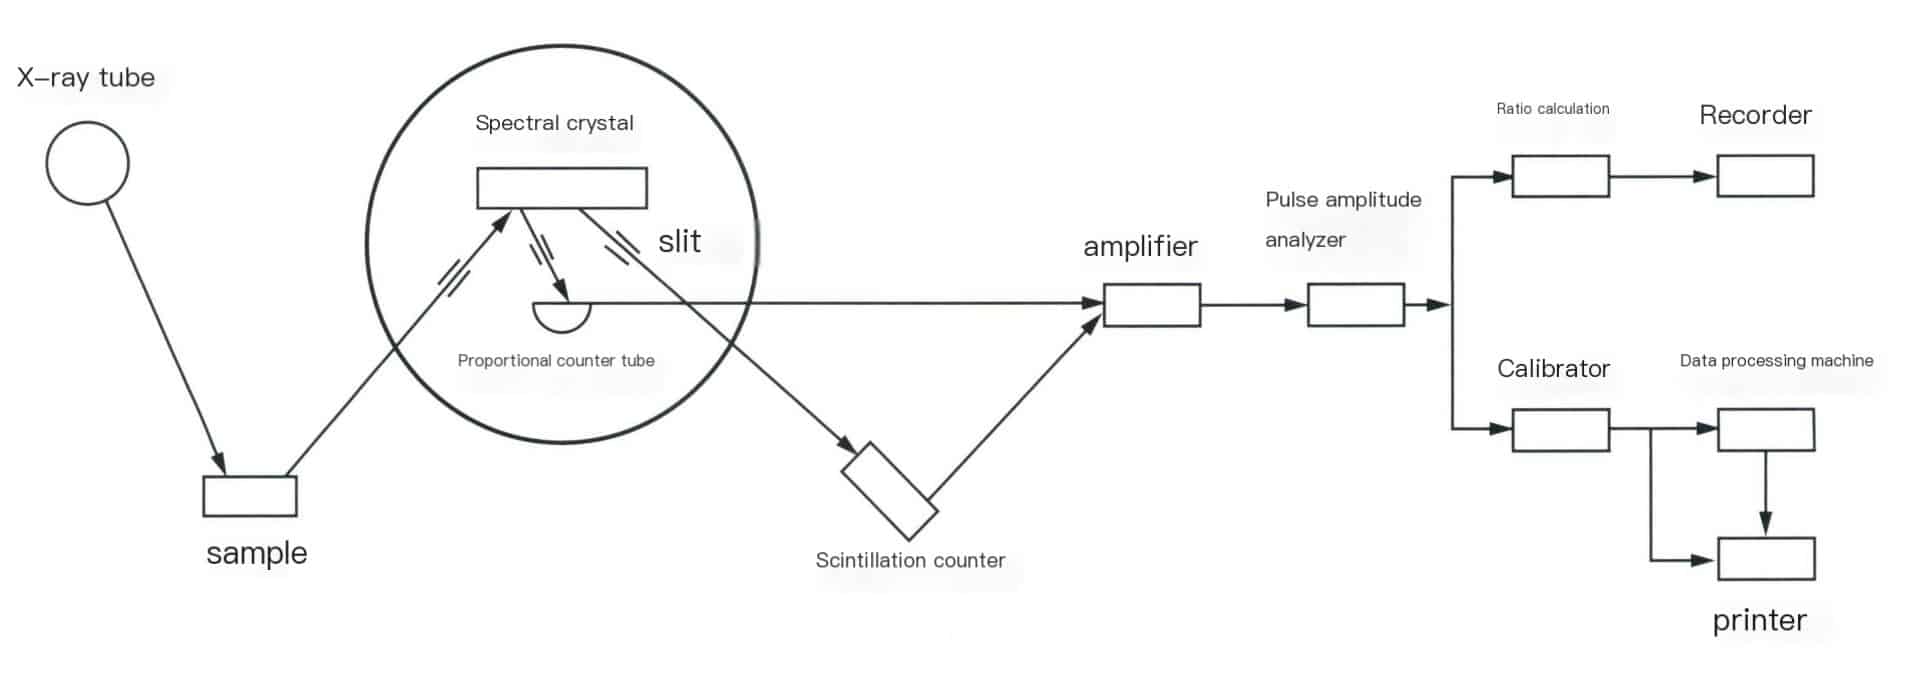
(1) X-ray tube.
The X-ray tube is the device that generates X-rays, essentially a high-voltage vacuum diode, which includes a cathode that emits electrons and an anode (target) that receives electrons. Electrons bombard the anode target surface to produce X-rays, which are emitted from the window of the X-ray tube and irradiate the sample. Lightweight element materials are selected to reduce the absorption of X-rays of various wavelengths by the window, and commonly used X-ray tubes often use beryllium windows.
(2) Spectroscopic system.
It consists of several parts, including the sample chamber, slits, and spectroscopic crystals. The sample chamber is where the samples are stored, including components such as sample trays, boxes, sample holders, and sample rotation mechanisms. The samples can be solid (blocks, plates, rods, powders, etc.) or liquid. The slit, also known as a collimator or prism grating, serves to intercept the divergent X-rays generated from the sample, converting them into parallel beams that are projected onto the spectroscopic crystal or detector window. The role of the spectroscopic crystal is to separate or disperse spectral lines of different wavelengths. The basic principle of dispersion is to utilize the diffraction phenomenon of the crystal to separate characteristic spectral lines of different wavelengths, allowing for the selection of characteristic X-rays of the measured elements for determination.
(3) Detection system.
It receives X-rays and converts them into measurable or observable signals. Signals, such as visible light, electrical pulse signals, etc., are measured through electronic circuits. Common detectors in modern X-ray fluorescence spectrometers include scintillation counters, proportional counters, and semiconductor detectors.
Scintillation counter: It is a commonly used counter with high detection efficiency for short-wave X-rays, and its detection efficiency for heavier elements can be close to that of X-rays with wavelength less than 3A. It consists of a scintillator, photomultiplier tube, high-voltage power supply, and other components in the X-ray analysis of its energy resolution for heavy elements for 25%-30% and lighter elements for 50%-60%.
Proportional counter: Divided into closed proportional counters and gas-flow proportional counters.
Proportional counters are used to detect X-rays with wavelengths greater than 3A. Modern X-ray spectrometers commonly use gas-flow proportional counters. To reduce the absorption of long-wave X-rays, the aluminum-coated polyester film used as the detector window material is very thin (commonly 6um, but there are even thinner ones). The thin window cannot prevent gas leakage, so fresh gas is introduced to expel air using gas flow. P10 gas (90% argon, 10% methane) is the most widely used mixed gas. The energy resolution of proportional counters is better than that of scintillation counters.
Closed proportional counters permanently seal ionized gases, such as inert gases, oxygen, nitrogen, etc., to prevent gas leakage and are equipped with relatively thick beryllium or mica windows, with mica window thickness usually 12-15um. Other conditions are the same as those of gas-flow proportional counters.
Semiconductor detectors: Mainly used in energy dispersive spectrometers, their advantages are high detection efficiency and energy resolution, allowing energy detection from most characteristic spectra of light and heavy elements.
(4) Recording system.
Composed of an amplifier, pulse amplitude analyzer, and readout section. Amplifier: includes a preamplifier and a linear amplifier (the main amplifier). The pulse amplitude output from scintillation counters and proportional counters generally ranges from tens to hundreds of millivolts; weak electrical signals cannot be counted directly and must be amplified. The preamplifier amplifies first, usually by ten to several tens of times, and the main amplifier further amplifies the input signal pulses, resulting in pulse amplitudes that meet the requirements of the subsequent discrimination circuit, with amplification factors reaching 500-1000 times. Pulse amplitude analyzer: its function is to select a certain range of pulse amplitudes, allowing the analysis line’s pulses to be distinguished from interference and background while suppressing interference and reducing costs to improve the sensitivity and accuracy of the analysis. The readout section comprises a calibrator, ratio meter, printer, and other components.
2.2 Simultaneous automated X-ray fluorescence spectrometer (also known as multi-channel X-ray fluorescence spectrometer)
It comprises a series of single-channel instruments, each with its own crystal, collimator, detector, amplifier, pulse height analyzer, and counting calibrator arranged radially around a common X-ray tube and sample. Most channels are fixed, meaning they analyze specific element spectral lines at an angle of 20, equipped with the best components suitable for that element’s spectral line. This type of channel is called a fixed channel. Currently, instrument models with 22 channels, 28 channels, 30 channels, etc., can be seen. Another channel type is a scanning channel; a multi-channel spectrometer has 1-3 scanning channels, which have motor-driven mechanisms for qualitative analysis with 2ϴ scanning.
Multi-channel instruments can simultaneously determine various elements in a sample, making them suitable for analyzing a large number of similar samples. However, this type of instrument has a large structure, is expensive, and its application could be more extensive.
2.3 Energy dispersive X-ray fluorescence spectrometer
The comparison between wavelength dispersive X-ray fluorescence spectrometer and energy dispersive X-ray fluorescence spectrometer only lies in the difference in separating (dispersing) the characteristic X-rays emitted from the sample. The former uses crystals for spectroscopy, while the latter commonly uses a semiconductor detector with high energy resolution and a multi-channel pulse amplitude analyzer for energy screening analysis. The structure of a modern energy-dispersive X spectrometer is shown in Figure 6-4.
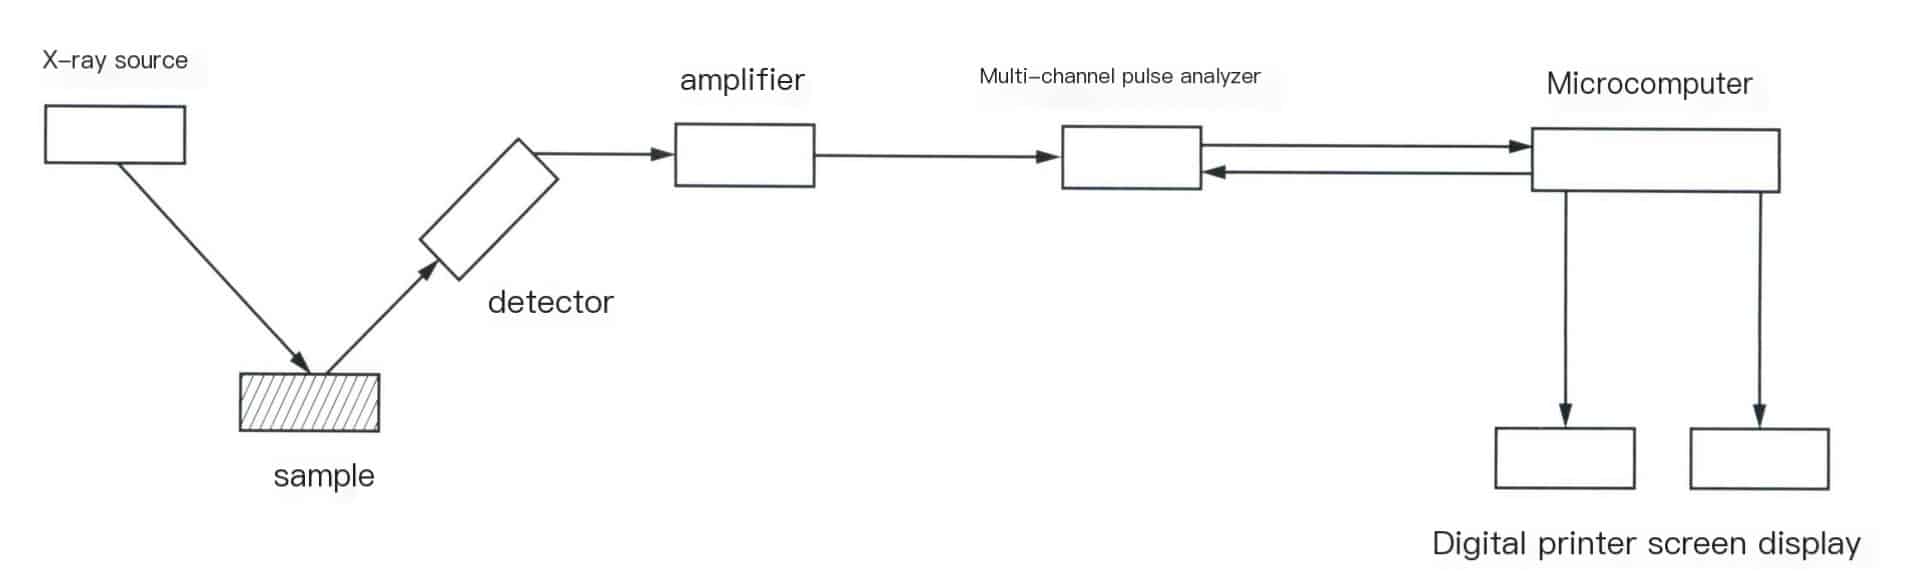
In energy-dispersive X-ray fluorescence spectrometers, the X-ray source can be an X-ray tube or a radioactive isotope as the excitation source. The characteristic X-rays emitted by the sample are sent to a semiconductor detector [commonly used Si(Li) detector] for detection, resulting in a series of current pulses proportional to the amplitude and photon energy. After amplifying the output of the detector, it is sent to a multichannel pulse height analyzer for pulse analysis. The various pulse height distributions obtained are displayed or recorded as energy spectra, where the displayed image is a spectrum of intensity versus pulse height or intensity versus photon energy. The concentration (content) of elements is determined based on the height of the energy spectrum peaks.
Since, in most cases, radioactive isotopes are used as excitation sources, this type of X-ray is also known as a “soft” XX-ray. The energy-dispersive X-ray fluorescence spectrometer made with “soft” X-rays is lightweight because it eliminates a lot of components and systems related to the X-ray source.
3. Characteristics of X-ray fluorescence spectroscopic analysis
3.1 Advantages
(1) A wide range of elements can be analyzed; almost all of the first 92 elements in the periodic table can be analyzed.
(2) The range of element content that can be analyzed is quite broad, from a few hundred thousandths to 100%, with precision comparable to other detection methods.
(3) This method is a non-destructive analytical method, meaning the sample will not be damaged during the analysis process, will not cause changes in chemical state, and will not result in sample dispersion. The same sample can be measured repeatedly, meeting the detection needs of precious metal jewelry. It is particularly suitable for the quality assessment and authenticity verification of precious metal products.
(4) The analysis speed is fast. The time required for measurement is related to the precision of the measurement, but it is generally very short, and all the elements to be measured in the sample can be completed in 2-5 minutes.
(5) It is independent of the analytical sample’s morphology and chemical bonding state; solid samples, liquids, pressed blocks, powders, films, or samples of any size can be analyzed.
(6) The analysis cost is low, and the professional background and technical proficiency required of the operators are not high.
3.2 Limitations
(1) Non-metallic elements and those between metals and non-metals are difficult to detect accurately. When testing with basic parameter methods, errors will occur if the test sample contains light elements such as C, H, or O.
(2) Representative samples are needed to create standard curves, and the accuracy of the analysis results is based on the chemical analysis of standard samples, which can easily be affected by interference from other elements and overlapping peaks. The standard curve model needs to be updated occasionally; when there are changes in the instrument or standard samples, the standard curve model must also change.
(3) There is a potential contamination threat from radioactive isotope sources.
(4) The XRF method has a large detection error for gold jewelry with different matrices, does not consider the properties and uniformity of the samples, and especially cannot make accurate detections for surface-treated gold jewelry and gold-plated items. The limitation of the density method is that if the alloy type is judged incorrectly, it can lead to significant errors or even incorrect conclusions. However, if the relative proportions of the alloy type and impurity elements are known in advance, its measurement accuracy surpasses that of other methods. Therefore, in specific applications, combining the density method and X-ray fluorescence spectroscopy is a very effective approach, where the two methods complement each other for verification: using X-ray fluorescence spectroscopy to detect the alloy type, roughly measuring the relative proportions of various impurity elements, and then using the density method to determine their content is widely applied in jewelry quality inspection stations, provided that the precious metal is a uniform alloy and not gold-plated or gold-filled.
4. Qualitative and Quantitative Analysis Methods of X-ray Fluorescence Spectrometer
4.1 Prepare the sample
Before analysis, check the sample’s variety, marks, appearance, etc.; samples with dirty surfaces should be wiped clean to ensure the measurement surface is contaminant-free.
In addition to testing institutions, jewelry companies extensively use X-ray fluorescence spectrometers to monitor the quality of materials and products during production. The samples to be analyzed can be solid or aqueous solutions, and the state of the sample affects the measurement error. Solid samples must have clean surfaces that are free of contaminants. For solid precious metal samples, attention should be paid to errors caused by component segregation. For example, due to segregation, jewelry castings made from the same gold tree but located at different positions may have different qualities. Samples with the same chemical composition but heat treatment processes will yield different counting rates. For non-uniform precious metal samples, they should be remelted to achieve uniformity, quickly cooled, and then rolled into sheets or taken from their fracture; uneven surface samples should be polished flat; for powder samples, they should be ground to 300-400 mesh and then pressed into discs, or placed in sample holders for measurement. Liquid samples can be dropped onto filter paper, and after drying the moisture with an infrared lamp, they can be measured or sealed in sample holders.
4.2 Qualitative analysis to determine the main elements and impurity components of the sample
Different elements have their specific wavelengths or energies of fluorescent X-rays, so the composition of the elements can be determined based on the wavelength or energy of the fluorescent X-rays. If it is a wavelength-dispersive spectrometer, the wavelength λ of the X-rays can be determined from the angle 2ϴ at which the detector rotates for a crystal with a certain interplanar spacing, thus determining the elemental composition. For energy-dispersive spectrometers, the energy can be identified by channels, thus determining which elements and components are present. However, manual identification is still required if the element content is too low or there is spectral line interference between elements. First, identify the target material of the X-ray tube. Measure X-ray and accompanying lines of strong peaks, then label the remaining spectral lines based on energy. When analyzing unknown spectral lines, factors such as the source and properties of the sample must be considered to make a comprehensive judgment.
4.3 Select standard samples and draw calibration curves
Based on the results of the qualitative analysis, select standard samples that match the purity level and impurity components. Generally, the following requirements apply:
(1) The types of elements in the standard sample must be similar to those in the unknown sample and should be the same.
(2) The content of all components in the standard sample must be known.
(3) The content range of the measured elements in the standard sample should include all the measured elements in the unknown sample.
(4) The state of the standard sample (such as the particle size of powder samples, the surface smoothness of solid samples, and the chemical state of the measured elements, etc.) should be consistent with the unknown sample, or it should be able to be processed to be consistent by appropriate methods.
Testing of specimens, each measured no less than three times. After repeated measurements, calculate the average value and then use the standard values of each element’s content and the corresponding average values as parameters to plot the calibration curve and derive the linear equation. Generally, laboratories should regularly verify the calibration curve.
4.4 Detect samples and calculate quantitative analysis results
The sample is tested in a sample chamber and quantitatively analyzed by X-ray fluorescence spectrometry, which is based on the fact that the fluorescence X-ray intensity of an element Ii , is directly proportional to the amount of that element in the sample Ci
Ii = Is x Ci
In the formula, Is is the fluorescence X-ray intensity of the element when Ci =100%.
According to the above formula, quantitative analysis can be performed using standard curve methods, incremental methods, internal standard methods, etc. However, these methods require that the composition of the standard sample be as similar as possible to that of the test sample; otherwise, the matrix effect of the test sample refers to the changes in the basic chemical composition and physical and chemical state of the sample, which affect the intensity of the X-ray fluorescence. Changes in chemical composition can affect the sample’s absorption of primary X-rays and X-ray fluorescence and can also alter the fluorescence enhancement effect.
Based on the calibration curve, substitute the measured values into the linear equation of the calibration curve to calculate the corrected value of the sample measurement. For each sample, select no less than three representative test values from different locations and calculate their average through repeated measurements.
5. Affecting the Detection Accuracy of the XRF Method
XRF utilizes the relationship between the fluorescent intensity of elements and their content in many standard substances with similar properties to establish a mathematical calibration curve and then determines the content by measuring the fluorescent intensity of elements in unknown samples. To obtain highly accurate detection results, establishing the standard working curve and choosing calculation methods are very important.
5.1 Standard Working Curve
Standard substances (standard samples) are the basis for establishing standard working curves. However, there currently needs to be more commercially available standard substances for precious metal jewelry in the domestic market, and the types of impurities in precious metal ornaments are diverse. It is difficult to meet the requirements for standard substances that match the impurity composition, as they rely solely on commercially available national standard substances. This leads to significant deviations in analytical results due to matrix effects. For example, in the calibration of the gold series standard substances, if there are no impurity elements like nickel, then using an X-ray fluorescence spectrometer to measure nickel-containing white K gold will inevitably result in errors.
When establishing a working curve for fitting, it is essential to reasonably select correction elements. Whether enhancement, absorption, overlap, or interference, one must consider the calculated errors after curve fitting and the actual testing deviations of standard samples to determine whether the selected elements and methods are truly effective.
The most important criterion during curve fitting is that the apparent content points on the curve should be similar to the recommended value points. The calculated correction coefficients should have positive and negative values so that the results of actual tests can be closer to their true values, making the measurement data authentic and reliable.
5.2 Selection of Calculation Methods
X-ray fluorescence spectroscopy commonly uses three quantitative analysis methods: direct method, difference method, and normalization method.
(1) Direct Method. It calculates the content of Au by substituting the intensity of Au into the corresponding intensity and content linear relationship equation.
(2) Difference Method. It obtains the content of the main element by directly subtracting the content of impurity elements from the total amount of 100%.
(3) Normalization Method. It assumes the normalized content to be 100%, sums the content values of each element, and compares it with 100%. The excess part is weighted for each element to derive the final content values of each element.
When the content of the precious metal element to be tested is greater than 75%, the linear relationship between the main element content and intensity becomes weaker, and the results obtained directly from the linear relationship tend to be inaccurate. Switching to the linear relationship of impurity elements can yield relatively accurate impurity element content. Using the normalization method or the difference subtraction method can provide more accurate main element content. When the content of precious metal elements is less than 75%, using the linear relationship between the intensity and content of Au directly for calculations yields more accurate results.
Copywrite @ Sobling.Jewelry — Custom jewelry manufacturer, OEM and ODM jewelry factory
Section V Fire Assay Method (Cupellation Method)
Fire assay, also known as the cupellation method, determines the content of precious metal components in minerals and metal products through melting and roasting. Fire assay is not only an ancient means of enriching gold and silver but also an important method for gold and silver analysis. Geological, mining, and gold and silver smelting industries, both domestically and internationally, widely apply it as the most reliable analytical method in production.
Fire assay is internationally recognized as the most accurate method. Several countries have designated it as a national standard, and it has become the internationally designated arbitration method for determining gold content. China’s standard “Regulations and Naming Methods for the Purity of Precious Metals in Jewelry” (GB 11887-2012) also designates fire assay as the arbitration method for measuring gold content in gold alloys.
1. Principle of Fire Assay Method
Weigh a certain mass of the gold sample to be analyzed, add an appropriate amount of silver, wrap it in lead foil, and melt it at a high temperature. The molten lead can capture gold, silver, and precious metals, completely dissolving the exposed gold and silver in the molten state. The lead in the molten alloy is easily oxidized in air or oxygen, forming molten lead oxide. The surface tension and relative density of lead oxide differ from molten lead, causing the molten lead to sink to the bottom and form a lead button. At the same time, the porous ash dish absorbs the molten lead oxide due to its wetting properties and capillary action. The cohesive force of molten lead is strong and is not absorbed by the ash dish. After the molten lead oxide seeps into the ash dish, the molten lead exposes a new surface and is oxidized again, and the ash dish absorbs the newly formed molten lead oxide. This process continues repeatedly until all the lead is oxidized into lead oxide and absorbed by the ash dish, achieving good separation of the lead button and the slag. During this process, other base metal elements may also partially or completely form volatile oxides or be absorbed by the ash dish, achieving the goal of removing impurity elements and obtaining purer precious metal particles. After the ash blowing, the alloy particles are treated using the property that silver dissolves in nitric acid while gold does not, dissolving the silver in nitric acid and separating the gold. The gold content of the sample is calculated after weighing the gold separated from nitric acid and correcting it with a pure gold standard sample measured simultaneously.
2. Advantages and Disadvantages of Fire Assay
2.1 Advantages
(1) The fire assay method has a wide range of applications and can be used to determine the gold content in various gold and K gold jewelry with gold content between 333.0% and 999.5%. It is recognized as a classic testing method in jewelry industry testing institutions.
(2) The analysis results are reliable, with high precision and accuracy.
(3) The sample size is large and representative, which can significantly reduce sampling errors.
2.2 Disadvantages
(1) It is a destructive method requiring the destruction of samples for testing, resulting in high detection costs.
(2) It is not suitable for samples of high-purity gold jewelry (gold content above 999.5%) and samples containing impurities that are insoluble in nitric acid (such as Ir, Pt, Rh, etc.).
(3) The ash fusion process requires using the harmful element Pb as a collector, posing safety risks to the health of inspectors and the environment.
(4) The analysis process is lengthy, with many experimental steps and complex operations, requiring a high level of professional skills and experience from the experimental personnel.
3. Equipment and utensils used in the fire assay method
3.1 Ash Blowout Furnace
The high-temperature Ash Blowout Furnace is used for fire assay (a muffle furnace). The muffle furnace specifically designed for ash blowing should have air intake and exhaust ports to allow for air circulation, preferably capable of preheating the air and ensuring stable passage, as shown in Figure 6-5, with the furnace temperature able to be evenly heated from room temperature to 1100℃.

3.2 Analytical Balance
The fire assay method is a quality analysis method that has strict requirements for the analytical balance, generally requiring a sensitivity of precision analytical balance within 0.01mg. The balance and weights must be calibrated regularly, with calibration cycles ideally set to 1 month or one quarter, depending on the workload.
3.3 Gold Separation Basket
The materials used to make gold separation baskets vary by country. In China, assay laboratories often use platinum or stainless steel plates, as shown in Figure 6-6.

3.4 Rolling Mill
Used to compress the alloy into thin sheets, requiring the thickness of the rolled sheets to be uniform and consistent to avoid increasing analytical errors.
3.5 Ash Dish
The ash dish is a porous refractory vessel that absorbs lead oxide during the lead-blowing process. Common ash dishes include cement ash dishes, bone ash cement ash dishes, and magnesia ash dishes (Figure 6-7).

4. Analysis Steps of Fire Assay
Taking gold alloy jewelry with gold content between 333.0% and 999.5% as an example, the process of analyzing its gold content is mainly divided into eight steps: pre-analysis, weighing, silver replenishment, lead cladding, ash blowing, rolling, gold separation and calculation of results.
4.1 Pre-analysis
Common pre-analysis methods include the weight method and X-ray fluorescence spectroscopy (XRF). The weight method has higher accuracy for pre-analysis but takes longer. The XRF method is fast and can simultaneously analyze the impurity element content in the sample, but it has a larger margin of error. For general samples, XRF can be used for pre-analysis to understand the basic composition of the sample, facilitating the calculation of the quality of standard samples of silver, copper, nickel, etc. For irregular shapes or samples with larger XRF analysis errors, the weight method can be used for pre-analysis.
4.2 Weighing
Weigh 200-300mg standard gold samples in three or four portions and three or four portions of test samples equivalent to the standard gold quality, accurate to 0.01mg. The samples should be cut into small pieces, mixed evenly, and weighed to make the weighing more representative. The weighing of standard gold and samples should follow the principle of consistency, with the component ratios as similar as possible. The weighing deviation between parallel standard gold and parallel samples should be controlled within 2%.
4.3 Silver replenishment
When supplementing silver, the ratio of silver to gold is crucial. If silver is less than twice the amount of gold, the gold separation cannot proceed. A large ratio of gold to silver can easily cause the gold roll to break. It is more appropriate for the amount of silver to be 2.1-2.5 times that of gold. The extremely poor silver amount should be controlled within 1%. Considering the total amount of base metals contained in the sample, an appropriate amount of copper should be added proportionally to the standard gold.
4.4 Lead cladding
Wrap the weighed standard gold and sample separately in lead foil, roll them up, and number them. The weight of the lead foil is generally 3.5g, and the lead packaging amount for the standard gold and sample should be as consistent as possible. The amount of lead is proportional to the impurity content of the sample; if the copper and nickel content is high, the amount of lead can be increased. The lead and sample should be tightly wrapped to minimize gaps, avoiding splashing losses caused by air expansion after the lead is placed, as shown in Figure 6-8.

Note: The numbers in the figure are sample numbers; the same applies below
4.5 Ash blowing
Place the standard gold wrapped in lead foil and the sample into the ash-blowing furnace, arranging the standard gold and sample in a cross pattern to avoid temperature discrepancies. The crucible should be preheated to above 920℃ to prevent residual organic matter and other volatiles from causing splattering. Maintain the furnace temperature at 920-1000℃, and continue heating in an oxidizing atmosphere until the sample completely melts, for about 25 minutes. If using a closed ash-blowing furnace, after maintaining it at 920-1000℃ for 30-40 min, slightly open the furnace door for oxidizing ash blowing, and close it after 10-15 min.
After ash blowing is complete, stop heating and allow the furnace to cool down to below 700℃ before removing it, as shown in Figure 6-9, to avoid rapid cooling that could cause rapid oxidation of the agglomerates, leading to splattering and spiking.

4.6 Rolling
Use a brush to remove the ash materials adhered to the alloy particles, flatten them on an anvil (Figure 6-10), and then anneal at 700℃. Use a rolling mill to roll the alloy particles into thin sheets of 0.15-0.2 mm (Figure 6-11), and then anneal again, avoiding excessive time. The direction in which the alloy particles are fed during rolling should be consistent to prevent sample cracking and loss. The thickness of the rolled sheets should be uniform to ensure consistency in value addition. Use a digital steel stamp to mark and roll into a cylindrical shape (Figure 6-12).
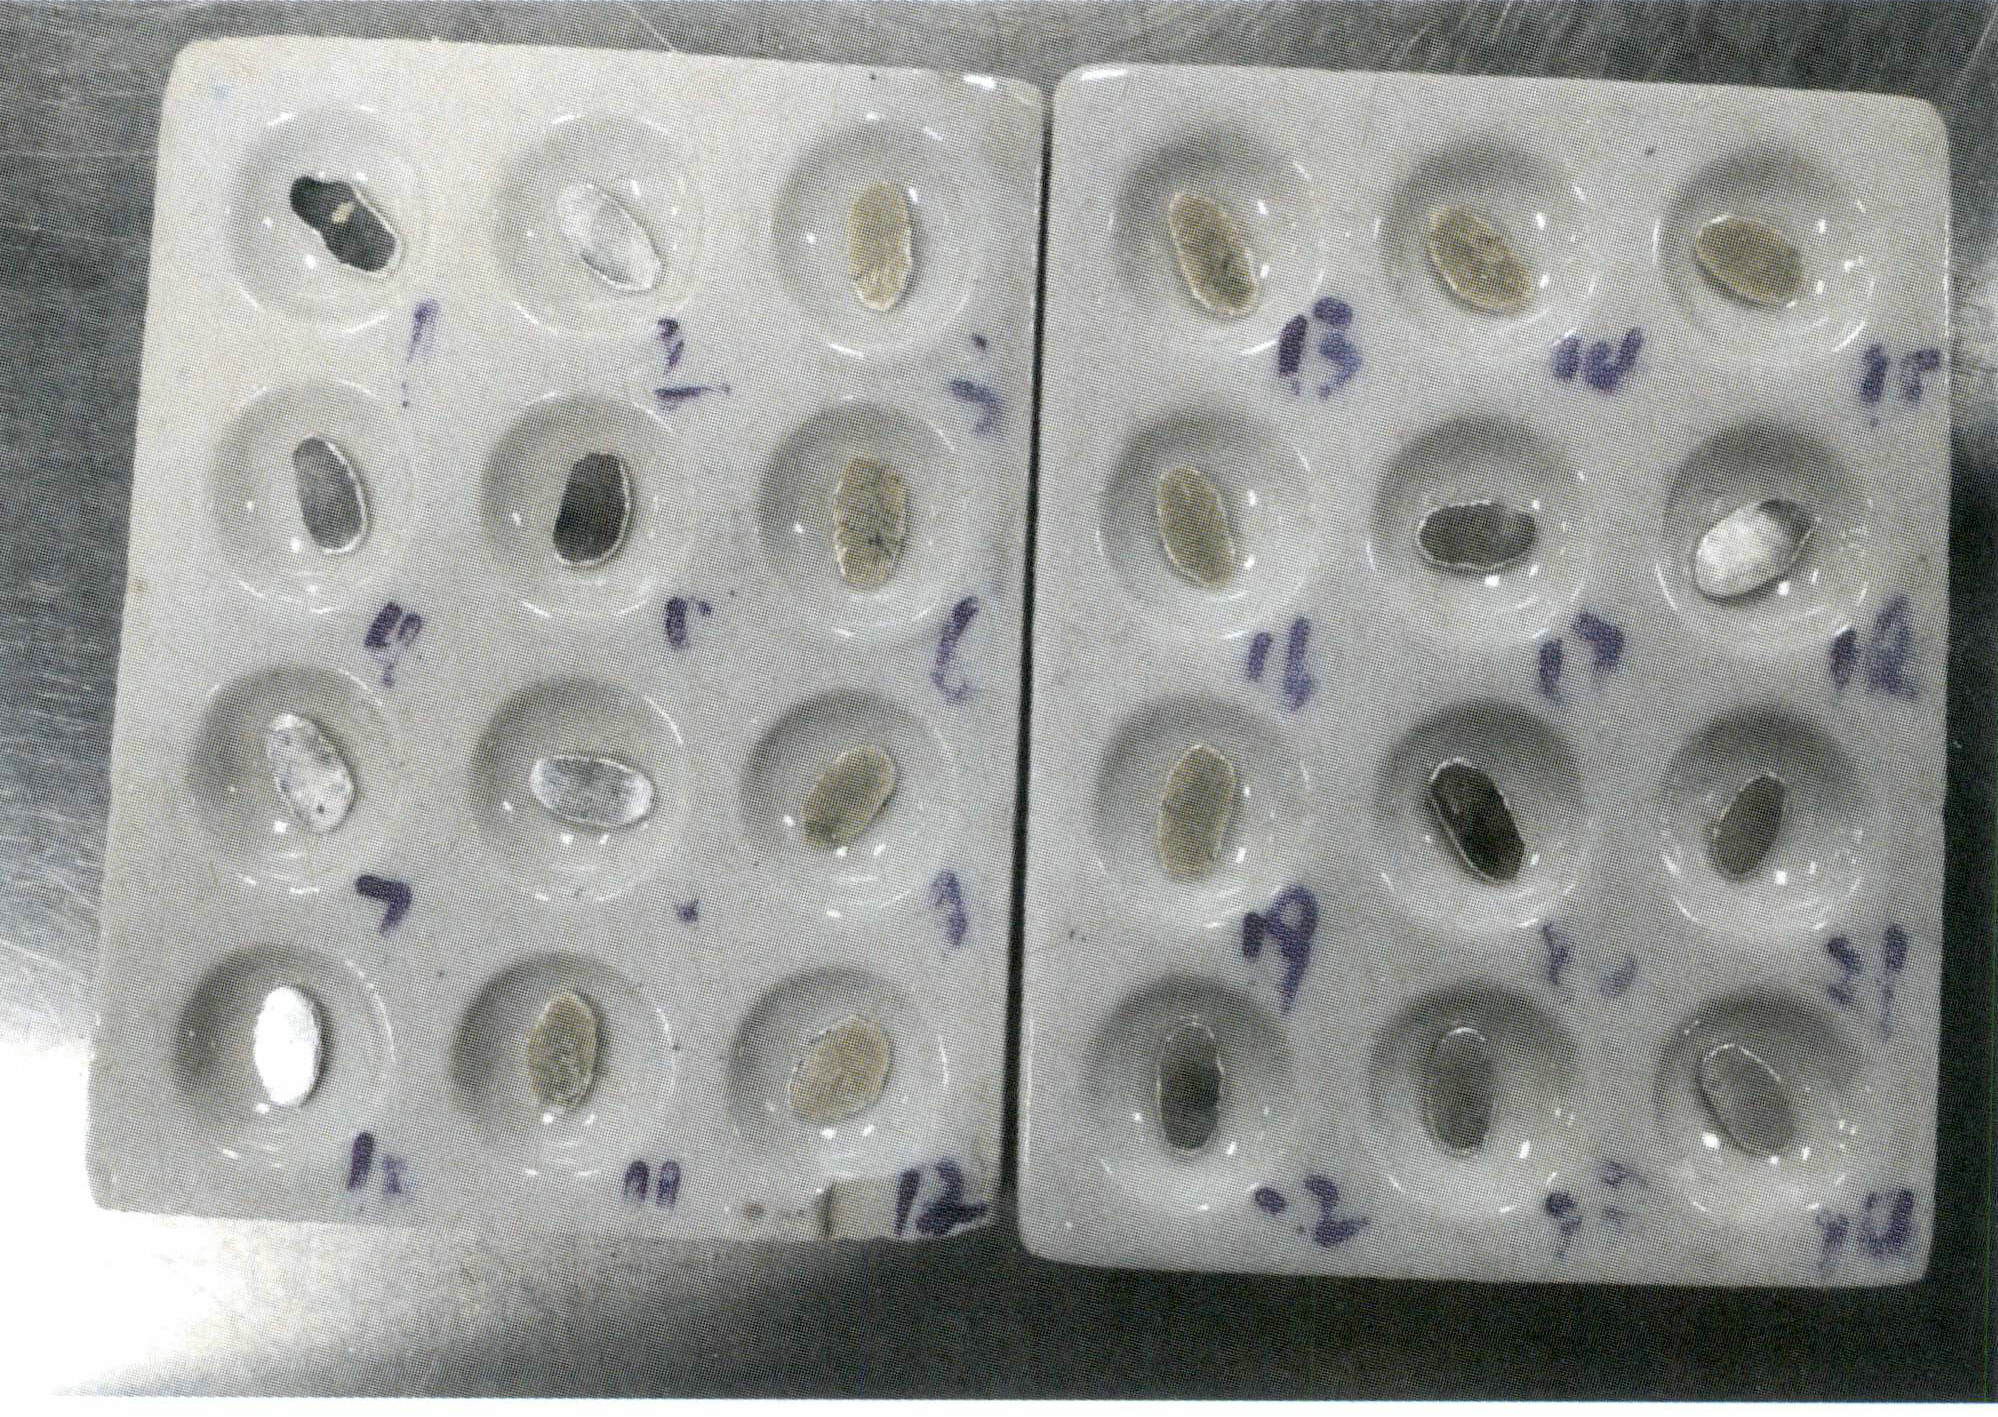
Figure 6-10 Flattening the alloy particles
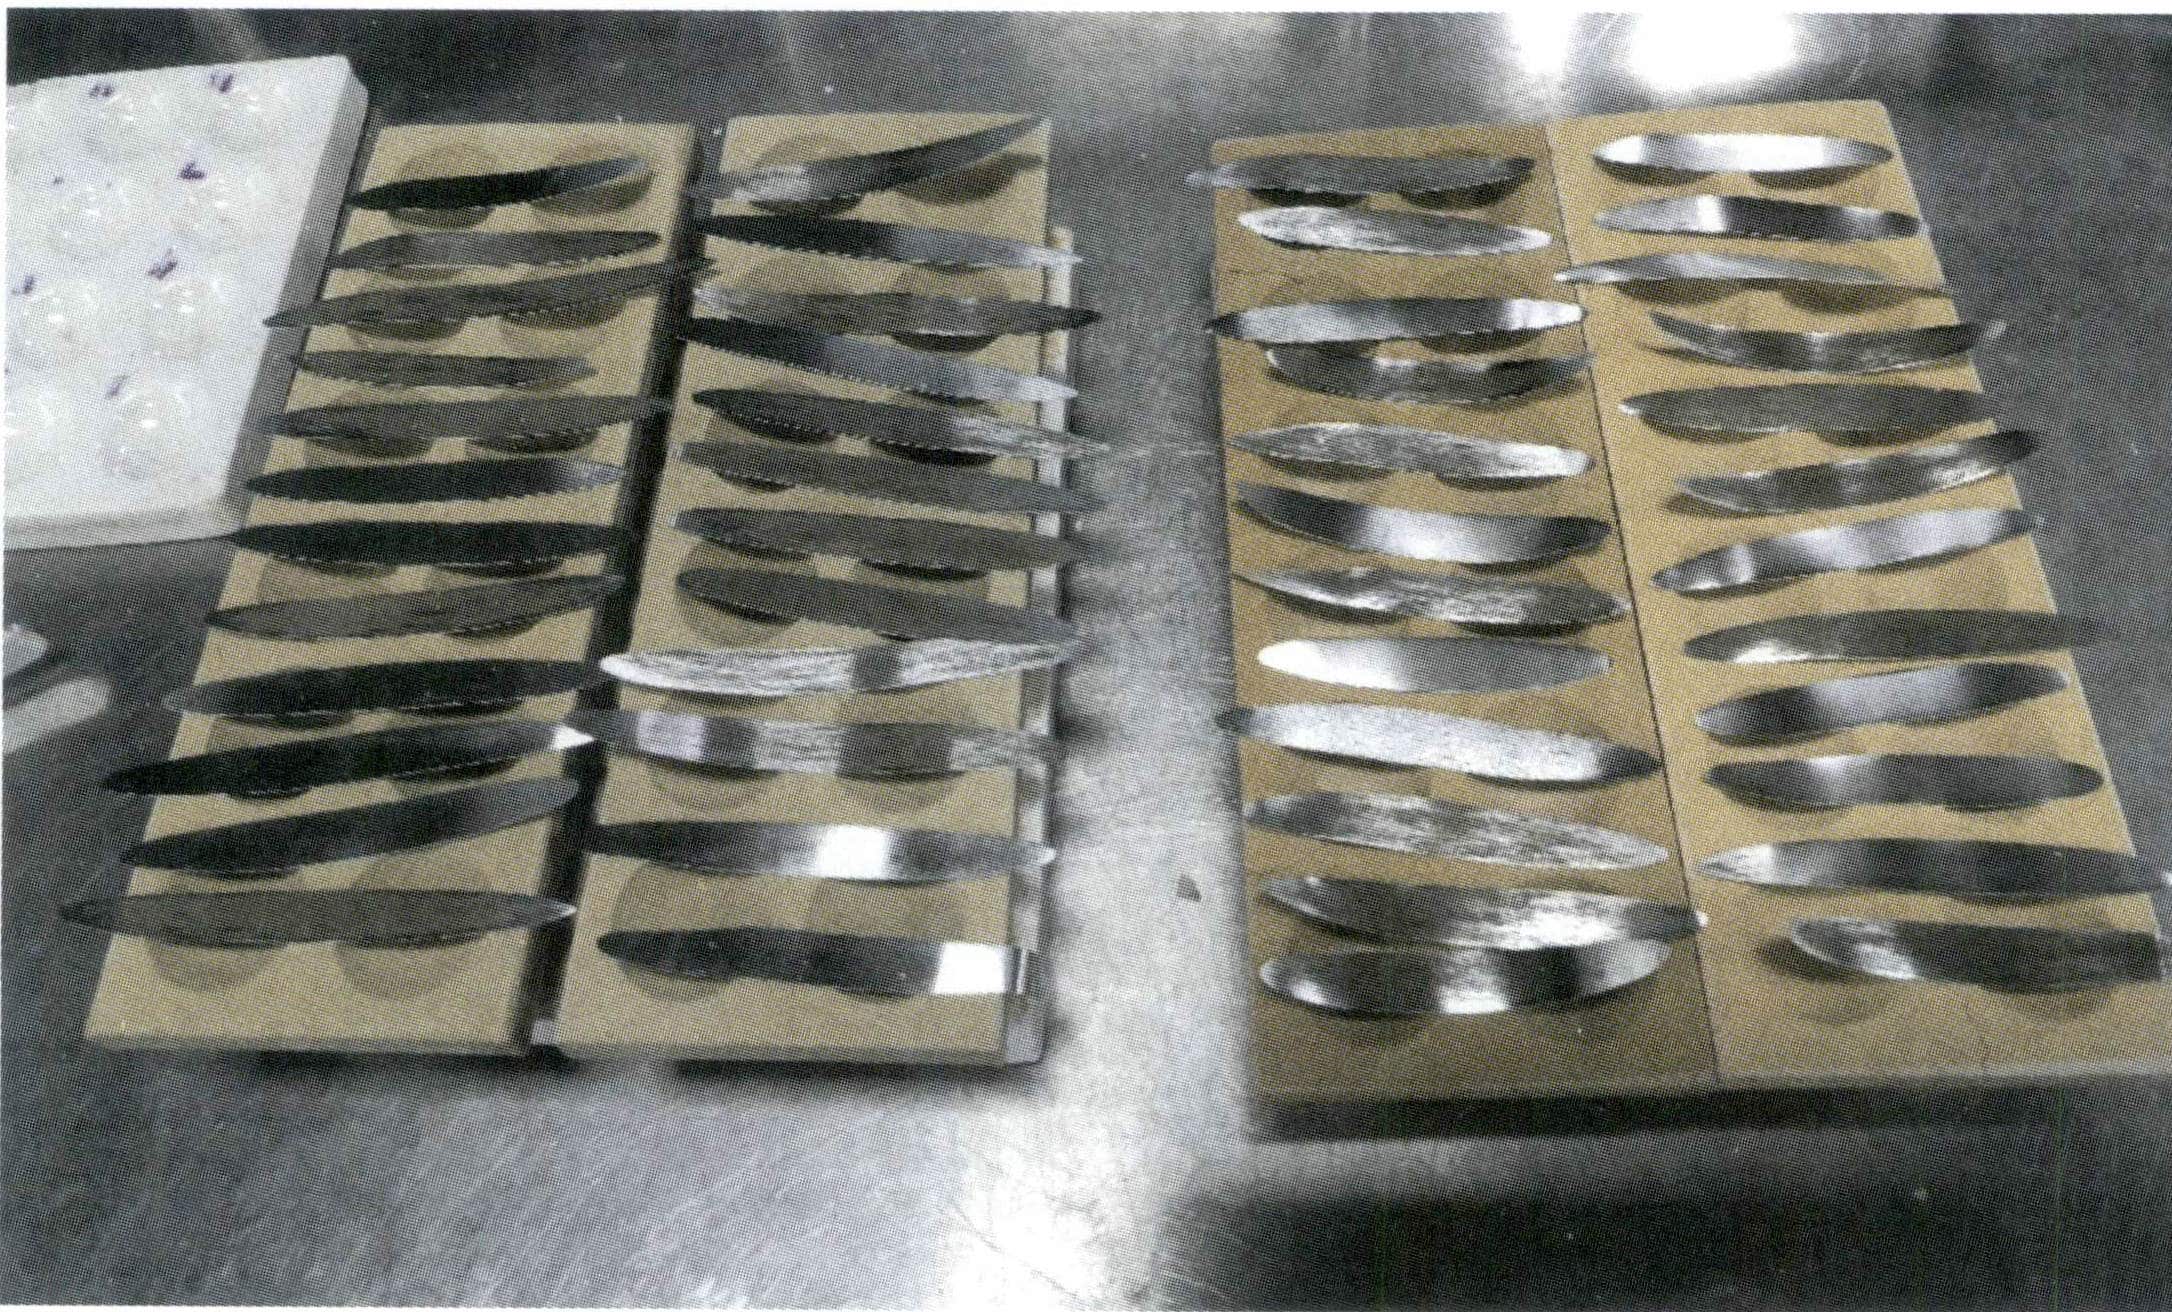
Figure 6-11 Rolling thin sheets

4.7 Gold Separation
Use nitric acid to dissolve silver from the gold alloy roll. Before separating the gold, clean the alloy roll, flask, or basket to prevent contamination or the introduction of chloride ions. Immerse the gold roll in a separation flask containing 20mL of near-boiling nitric acid, keeping it always below the boiling point at a temperature close to boiling, and heat continuously for 15 minutes or until the nitrogen oxide salt mist is driven off, as shown in Figure 6-13. Slowly pour out the solution, wash the gold roll with hot water 3-5 times, and then immerse it in boiling nitric acid and wash it again.

Carefully transfer the standard gold after separation to a porcelain crucible, dry it, and burn it to a golden yellow, as shown in Figure 6-14. After cooling, weigh the mass of the gold roll, which is accurate at 0.01mg.

4.8 Calculation result
Gold content Wt(Au) is calculated according to formula (6-3), with the result rounded to one decimal place:

In the formula:
m1 – sample mass (g);
m2 – a mass of the gold obtained after separating from the sample (g);
m3 – a mass of standard gold (g);
m4 – The quality (g) of the gold ingot obtained after standard gold analysis;
E – The purity of standard gold (‰).
The deviation in results caused by repeated experiments should be less than 0.2‰ for 999.0‰-999.5‰; Gold alloys should be less than 999.0‰ and less than 0.5‰; white K gold should be less than 1‰.
5. Factors Affecting the Accuracy of Fire Assay Analysis
When applying fire assay to analyze gold content, factors such as sample size, type of cupel furnace, material of the cupel, silver to gold ratio, cupellation temperature, and separation time will all affect the results. It is necessary to conduct accompanying experiments using gold standard samples and maintain consistency in the analysis conditions of the gold standard samples and the samples to obtain good parallelism and accurate, reliable results, eliminating systematic errors in the analysis process.
5.1 Sample Size
The sample size for analyzing K gold jewelry is generally small, related to the high content of alloying elements in K gold jewelry. However, a sample size that is too small will directly affect the sample’s representativeness and the analysis’s accuracy. The sample size can be appropriately increased for jewelry with higher purity and lower nickel and copper content for better results. For lower-grade K gold, the amount of lead foil can be appropriately increased to facilitate the separation of impurities. The standard gold appreciation should have a certain range of control and trade-offs to avoid systematic deviations.
5.2 Ash blowing Furnace
A regular muffle furnace can only meet the temperature requirements. It cannot provide the oxidizing gas flow needed during the cupellation process, which reduces the quality and effectiveness of the cupellation. Additionally, it poses certain safety hazards: to provide the oxygen required for oxidation, the furnace door must be opened slightly during the cupellation stage, causing a large amount of lead oxide to escape from the furnace door, resulting in serious lead contamination of the surrounding environment and endangering the health of the operators. Furthermore, prolonged use can lead to corrosion damage of the furnace chamber and opening by lead oxide, and the large amount of lead residue inside the furnace is difficult to discharge in time, which can easily contaminate the analysis samples. Therefore, a dedicated cupellation furnace should be prioritized.
5.3 Ashtray Material
When selecting the material and ratio for ashtrays, it is important to consider not only the ashtray’s ability to absorb impurity elements in the lead but also the recovery rate of gold and silver during the ash-blowing process. Magnesia ashtrays have a relatively high recovery rate, but there are issues with removing adhered particles at the bottom and determining the ash-blowing temperature and endpoint. Bone ash and cement ashtrays make it easier to judge and control the ash-blowing temperature and endpoint, resulting in purer aggregates that are less likely to break when struck into thin sheets. However, the recovery rate is relatively lower.
5.4 Silver to Gold Ratio
Silver has two roles in fire assay: extraction, which extracts gold from impurities, and protection, which reduces gold loss during the measurement process. A small amount of silver can increase gold loss and incomplete oxidation during ash blowing, but more silver is not always better. When the amount of silver added is three times the weight of gold, gold loss increases, and the gold can easily break during separation. Generally, the amount of silver added is related to the sample’s composition. During ash blowing, when nickel and palladium in white K gold alloys are captured, gold can also be lost, so a larger amount of silver is usually required as a protective agent to prevent gold loss. When analyzing gold content using fire assay for white gold alloys containing nickel but not palladium, nickel should be added to the standard gold in quantity roughly equivalent to the sample, and the amount of lead should be increased. For white gold alloys containing palladium, palladium should be added to the standard gold in a quantity roughly equivalent to the sample while increasing the lead amount.
5.5 Ash Blowing Temperature
Taking 18K gold as an example, under the same process conditions, when the ash-blowing temperature is within the 900-1500℃ range, the standard gold loss increases with the rise in ash-blowing temperature and shows a linear distribution. When the ash-blowing temperature is too high, silver is prone to evaporation and splashing, leading to increased errors in the analysis results; when the ash-blowing temperature is too low, the molten lead oxide and impurities may also clump together, which cannot be fully absorbed by the crucible, resulting in the analysis process being unable to proceed.
5.6 Gold Separation Time
Taking 18K white gold as an example, the gold measurement results decrease as the gold separation time increases, but after reaching a certain level, the gold measurement results remain unchanged.
Section VI Inductively Coupled Plasma Emission Spectroscopy (ICP Method)
The inductively coupled plasma emission spectrometer, also known as the ICP spectrometer or ICP atomic emission spectrometer, uses inductively coupled high-frequency plasma as the excitation light source, utilizing the characteristic emission spectra of each element’s atoms or ions to determine the composition of substances and conduct qualitative and quantitative analysis of elements. ICP discharge is a relatively simple and highly effective method that transforms aerosols and vapors of liquids and solids, as well as gases at normal pressure, into free atoms, excited state atoms, and ions or molecular fragments. It can quickly analyze various major, trace, and ultra-trace elements in materials. It is one of the most competitive methods for simultaneous multi-element analysis, characterized by a wide testing range, fast analysis speed, and low detection limits. It has high precision and accuracy for detecting high-content gold and is a commonly used method by jewelry industry testing institutions for determining high-content gold jewelry materials.
1. Principle of the ICP Method
The working principle of the ICP method is shown in Figure 6-15.

The high-frequency power generated by the radio frequency generator is applied to the three-layer concentric quartz torch tube through the induction working coil, forming a high-frequency oscillating electromagnetic field; argon gas is introduced into the outer layer of the quartz torch tube, and high-voltage discharge is performed to generate charged particles. The charged particles move back and forth in the high-frequency electromagnetic field, colliding with other argon ions, producing more charged particles. At the same time, the temperature rises ultimately forming argon plasma, with temperatures reaching 6000-8000 K. The sample of the aqueous solution to be tested is passed through the atomizer. The formed aerosol enters the central channel of the quartz torch tube, where it is fully evaporated, atomized, and ionized in high temperature and inert gas, emitting characteristic spectral lines of the elements contained in the solution; by collecting light from the plasma light source and using a scanning spectrometer for scanning, the light intensity of the characteristic spectral lines of the elements to be tested is accurately positioned at the exit slit. The light intensity of the spectral line is converted into photoelectric current using a photomultiplier tube. After circuit processing and analog-to-digital conversion, it enters the computer for data processing. The presence or absence of characteristic spectral lines identifies whether a certain element is present in the sample (qualitative analysis); based on the intensity of the characteristic spectral lines determines the content of the corresponding element in the sample (quantitative analysis).
2. Advantages and Disadvantages of the ICP Method
2.1 Advantages
(1) Ability to detect multiple elements simultaneously. It can detect multiple elements in the same sample at the same time. Once the sample is excited, each element emits its characteristic spectral lines, allowing for separate detection while simultaneously determining multiple elements.
(2) Fast analysis speed. Most samples can be analyzed without chemical treatment, and solid and liquid samples can be analyzed directly. Additionally, multiple elements can be determined simultaneously. Using a photonic direct-reading spectrometer, the quantitative determination of dozens of elements can be completed within minutes.
(3) Good selectivity. Due to the strong characteristic of the spectrum, it is particularly significant for analyzing elements with very similar chemical properties. For example, analyzing dozens of rare earth elements in Nb and Ta, Zr, and Hf is very difficult compared to other methods. At the same time, emission spectroscopy can easily distinguish and measure them.
(4) Low detection limit. The detection limit of a general light source is (0.1-10) x 10-6, with an absolute value of (0.01-1) 10-6; while using an inductively coupled plasma (ICP) light source, the detection limit can be as low as 10-9 orders of magnitude.
(5) Higher accuracy. The relative error of a general light source is 5% to 10%, while the relative error of ICP can reach below 1%.
(6) The linear range of the ICP light source standard curve is wide, reaching 46 orders of magnitude, allowing for multi-element analysis of a single sample, and can measure different concentrations of high, medium, and low levels.
(7) Low sample consumption, suitable for the multi-component determination of whole batches of samples, especially qualitative analysis, shows unique advantages.
2.2 Disadvantages
The disadvantages of the ICP method are as follows.
(1) Many factors affect the intensity of the spectral lines, such as sample composition, uniformity, sample parallelism, acid concentration, spectral interference, temperature, and humidity, all of which can impact the final detection results. There are high requirements for the components of the standard reference, and most non-metallic elements have difficulty obtaining sensitive spectral lines.
(2) Solid samples generally need to be converted into a solution beforehand, which often worsens the detection limit; the accuracy is poor when the concentration is high.
(3) Not suitable for samples containing impurities such as Ir that are insoluble in aqua regia.
(4) Requires an expensive inductively coupled plasma emission spectrometer, which consumes a large amount of argon during operation, resulting in high detection costs.
3. Instruments and reagents used in the ICP method
3.1 Instruments
Instruments include: Inductively coupled plasma emission spectrometers、Beakers、Volumetric flasks and so on other common laboratory glassware, high-precision electronic balances and etc.
3.2 Reagents
The water used for ICP testing meets the specifications for first-grade water or water of equivalent purity as specified in “Specifications and Test Methods for Water Used in Analytical Laboratories” (GB/T 6682-2008).
The chemical reagents used in ICP testing can be divided into two categories: sample decomposition and preparing standard solutions of elements. All reagents are required to be of analytical grade. When analyzing gold content, a high-purity gold sample with a purity not lower than 99.999% is needed.
4. ICP Analysis Steps
As an example, the steps include the following analysis of gold content in gold jewelry.
4.1 Sample Preparation
After grinding the sample thin, Cut it into small pieces, place them in a beaker, add 20mL of ethanol solution, heat, boil for 5 minutes, then remove it. Pour off the ethanol solution, and wash the gold piece repeatedly with ultrapure water three times. Add 20mL of hydrochloric acid solution, heat, boil for 5 minutes, then remove it. Pour off the hydrochloric acid solution, and wash the gold piece repeatedly with ultrapure water three times. Place the gold piece in a glass weighing bottle, cover it, and put it in the oven to dry at 105℃, then take it out for later use.
4.2 Solution Preparation
(1) Sample Solution. Weigh (1000±2.5)mg sample (accurate to 0.01mg), place it in a 100mL beaker, add 30mL of aqua regia, cover with a watch glass, and slowly heat until completely dissolved, continuing to heat to remove nitrogen oxides. After cooling, transfer the solution to a 50mL volumetric flask, rinse the watch glass and beaker with aqua regia solution, add the wash liquid to the volumetric flask, dilute to the mark, and mix well for later use. Prepare two portions of sample solution for each sample.
(2) Calibration Solution. Weigh three portions of high-purity gold samples with a mass of (1000±2.5)mg (purity > 99.999%), dissolve them to obtain three portions of high-purity gold solution, and prepare the calibration solution according to the following steps.
Calibration Solution 1:
Transfer the first portion of the high-purity gold solution to a 50mL volumetric flask. Rinse the watch glass and beaker with aqua regia solution. Add the wash liquid to the volumetric flask, Dilute to the mark, Mix well. The concentration of the measured impurity elements in Calibration Solution 1 is set to 0/ug/m.
Calibration solution 2:
Transfer the second portion of the high-purity gold solution to a 50mL volumetric flask pre-filled with 5mL of mixed standard solution 1. Rinse the surface dish and beaker with aqua regia solution. Add the wash liquid to the volumetric flask. Dilute to the mark. Shake well.
Calibration solution 3:
Transfer the third portion of the high-purity gold solution to a 50mL volumetric flask pre-filled with 5mL of mixed standard solution 2. Rinse the surface dish and beaker with aqua regia solution. Add the wash liquid to the volumetric flask, Dilute to the mark, Shake well.
4.3 Determination
Adjust the ICP spectrometer to optimal conditions; if testing gold alloy samples, select appropriate analytical lines and background correction according to Table 6-2.
Table 6-2 Recommended wavelengths for impurity elements (analytical lines) (Unit: nm)
| Element | Wavelength | Other available wavelengths | Element | Wavelength | Other available wavelengths |
|---|---|---|---|---|---|
| Ag | 328.068 | 338.289 | Ni | 352.454 | 231.604 |
| Al | 396.152 | 308.215 | Pb | 168.220 | 220.353 |
| As | 189.042 | 193.696 | Pd | 340.458 | 355.308 |
| Bi | 223.061 | 306.772 | Pt | 306.471 | 203.646 |
| Cd | 226.502 | 228.802 | Rh | 343.489 | - |
| Co | 228.616 | 238.892 | Ru | 240.272 | - |
| Cr | 267.716 | 283.563 | Sb | 206.833 | 217.581 |
| Cu | 324.754 | 327.396 | Se | 196.090 | - |
| Fe | 259.940 | 239.563 | Sn | 189.989 | 189.927 |
| Ir | 215.278 | - | Te | 214.281 | - |
| Mg | 279.553 | 280.270 | Ti | 334.941 | - |
| Mn | 257.610 | 260.569 | Zn | 213. 856 | - |
Measure the impurity element spectral line intensity of calibration solution 1,3, where the concentration of the measured impurity elements in calibration solution one is set to 0/ug/mL, and plot the working curve based on the test results; under the same conditions as the measurement calibration solution, measure the spectral line intensity of impurity elements in two sample solutions and obtain the concentration of each impurity element in the sample solution from the working curve.
4.4 Result Representation
(1) Calculation of the total amount of impurity elements. The total amount of impurity elements in the sample is calculated according to formula (6-4):

In the formula:
ƩA – total amount of impurity elements in the sample (‰);
ƩCi – total concentration of impurity elements in the sample solution ug/mL);
V – volume of the sample solution (mL);
m – Mass of the sample (mg).
(2) Calculation of gold content.
The gold content in the sample is calculated according to formula(6-5):

In the formula:
w(Au) – gold content in the sample (‰);
ƩA – Total amount of impurity elements in the sample (‰).
(3) Reproducibility. The relative deviation of the total impurity elements in two parallel determinations of the samples should be less than 20%; if exceeded, re-determination is required.
5. Factors of Interference in ICP Analysis
During the ICP detection process, interference phenomena are inevitably present, as shown in Figure 6-16. Based on the interference mechanism, it can be divided into two main categories: spectral interference and non-spectral interference. In contrast, according to the state of the interfering factors, it can be divided into gas-phase interference and condensed-phase interference.
Spectral interference and non-spectral interference are effects caused by the components of the sample matrix and accompanying substances, which enhance or weaken the already resolved analytical signals. Non-spectral interference includes sample preparation, spray, solvent removal, volatilization, atomization, excitation, and ionization interference, as shown in Figure 6-16.
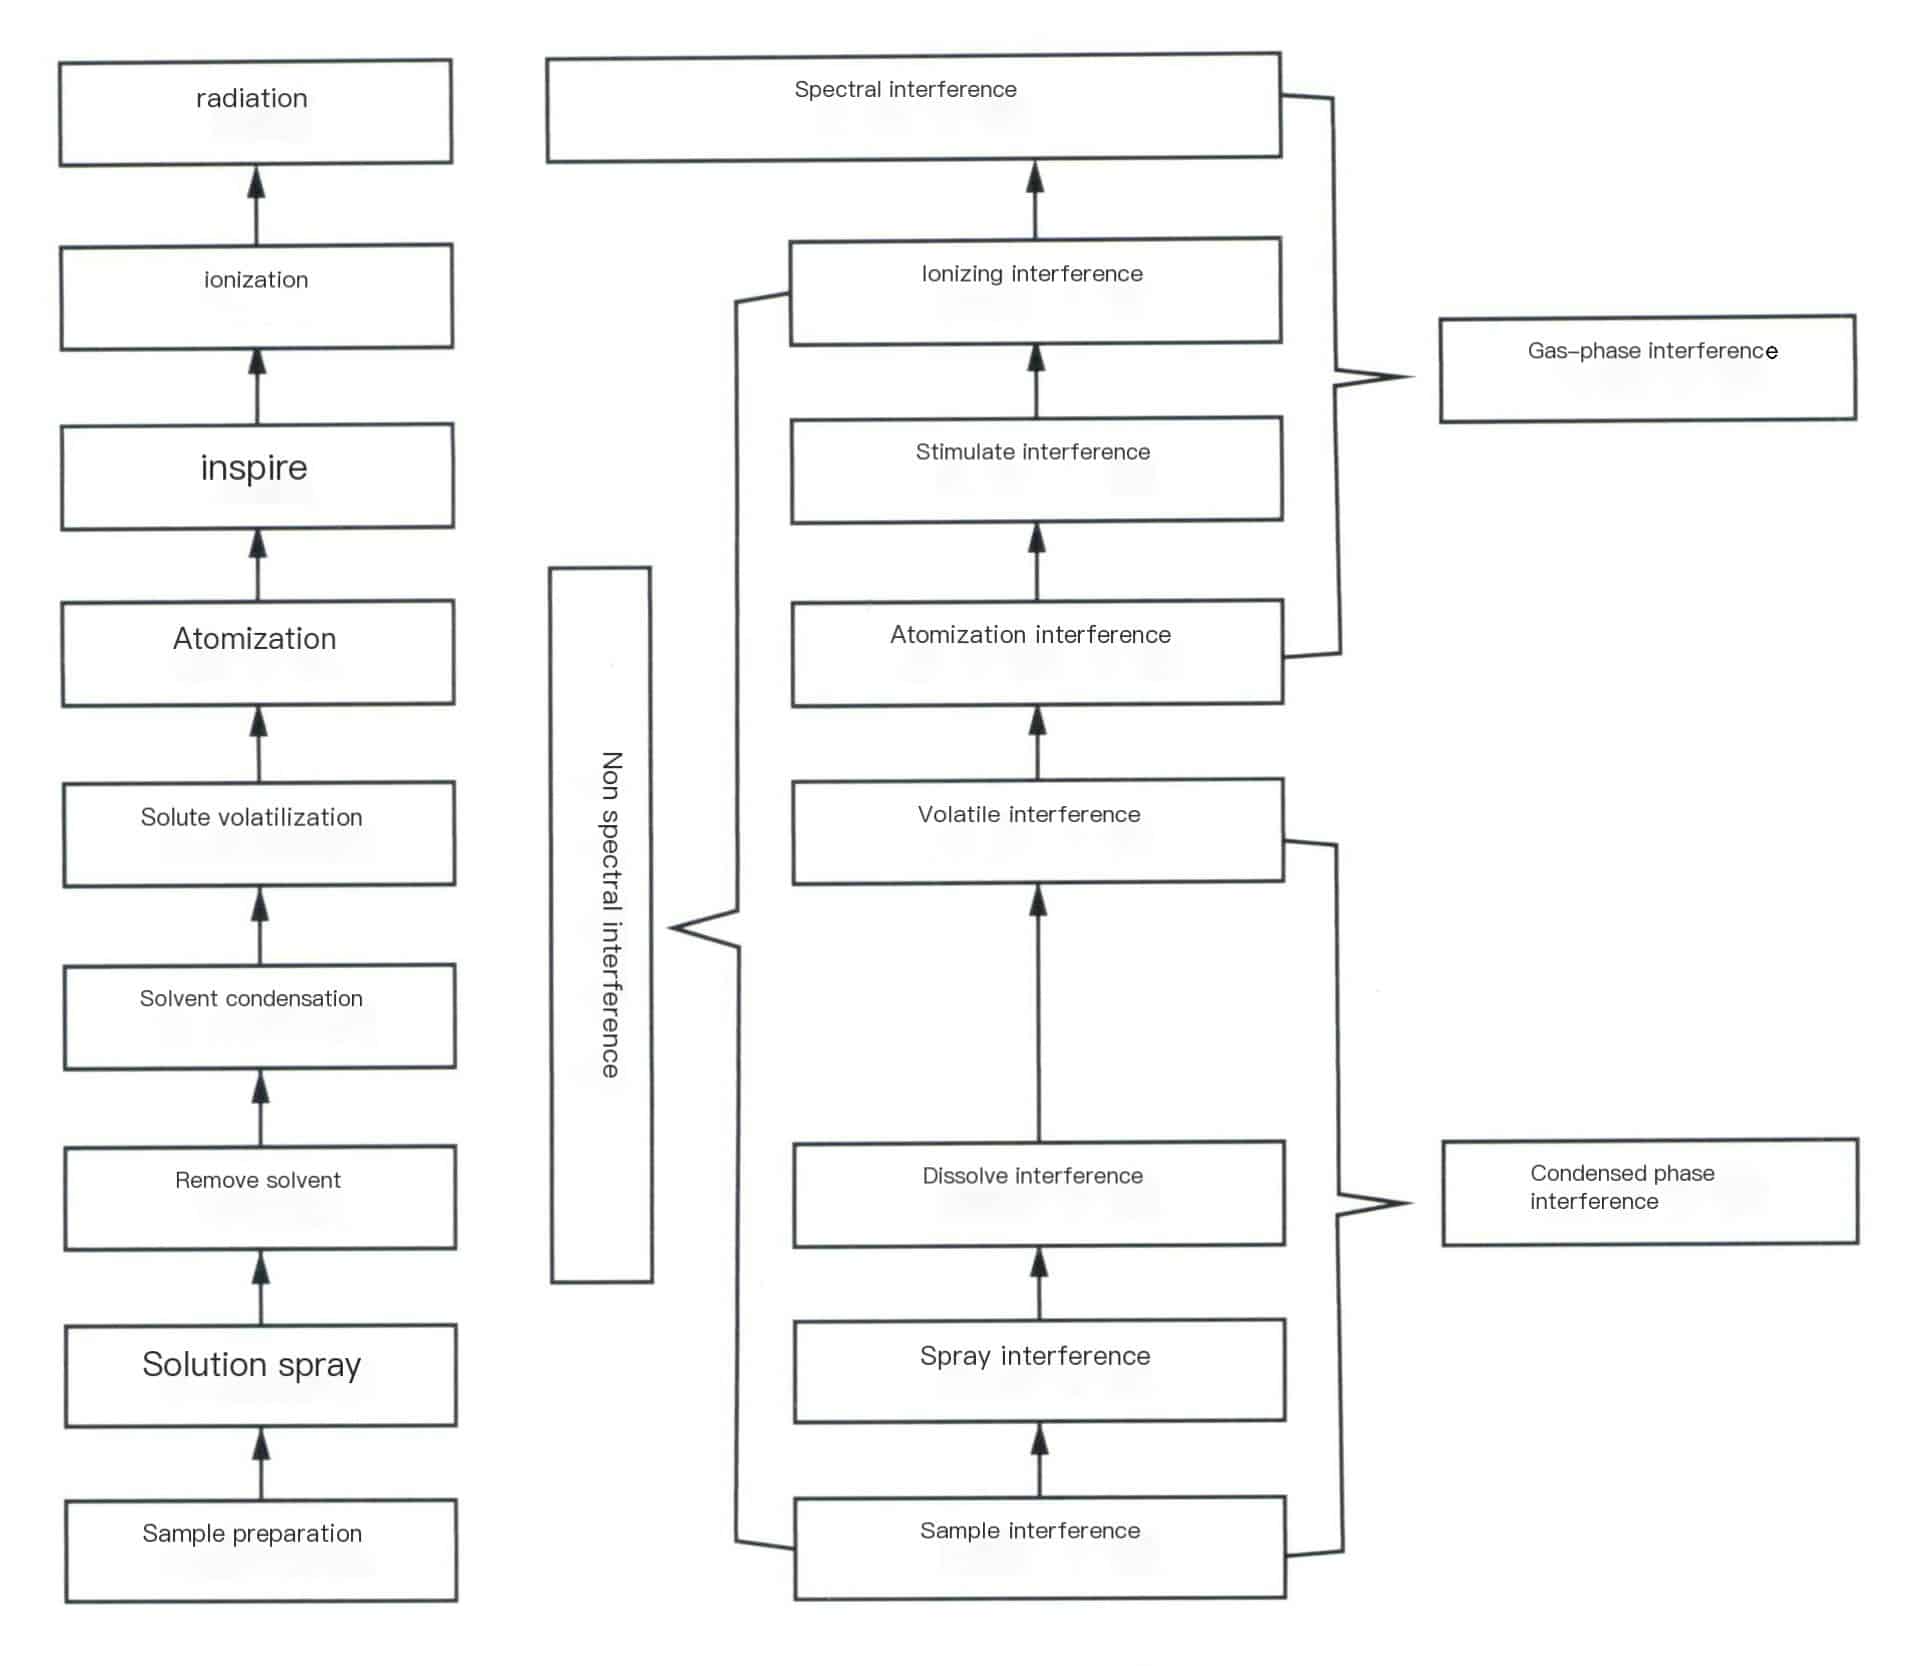
5.1 Spectral Interference
Spectral interference is caused by the inability to resolve the radiation signals generated by the analyte signals and interfering substances. It is the most important and troublesome issue in ICP spectrometry. Due to the strong excitation capability of ICP, almost every substance present in or introduced into ICP emits a considerable number of spectral lines, resulting in a large amount of spectral “interference.”
Spectral interference is mainly divided into two categories: one is line overlap interference, which is caused by the insufficient dispersion and resolution of the spectrometer, leading to the overlap of spectral lines of certain coexisting elements in the analysis; the other is background interference, which is related to the influence of the matrix composition and the strong stray light emitted by the ICP light source itself. Using a high-resolution spectroscopic system for line overlap interference does not mean that this type of spectral interference can be eliminated; it can only be considered that when spectral interference occurs, it can be reduced to minimum intensity. Therefore, the most commonly used method is to select another spectral line with less interference as the analytical line or to apply interference factor correction (IEC) for correction. The most effective method for background interference is to utilize the background correction technology available in modern instruments to deduct it. When interference occurs, they can be reduced to a minimum intensity. Therefore, the most commonly used method is to select another spectral line with less interference as the analytical line or to apply interference factor correction (IEC) for correction. The most effective method for background interference is to utilize the background correction technology available in modern instruments to deduct it.
5.2 Non-spectral interference
(1) Interference from physical factors.
Since the samples for ICP spectral analysis are in solution form, factors such as the viscosity, relative density, and surface tension of the solution all affect the atomization process, droplet size, aerosol transport, and solvent evaporation, and viscosity is related to the composition of the solution, the concentration and type of acid, and temperature.
When the solution contains organic solvents, both dynamic viscosity and surface tension will decrease, improving atomization efficiency. At the same time, most organic reagents are flammable, thus increasing the tail flame’s temperature and increasing spectral line intensity. At this time, the power of the ICP needs to be appropriately increased to suppress the intensity of the molecular spectrum of carbides in the organic reagents.
As seen above, the interference of physical factors exists and should be avoided. The main method is to ensure that the standard test solution and the sample to be tested are completely consistent regarding the composition of matrix elements, total salinity, concentration of organic solvents, and acids. Currently, the peristaltic pump sampling system used can help reduce the aforementioned physical interference. Additionally, internal standard correction can appropriately compensate for the effects of physical interference. Matrix matching or standard addition methods can effectively eliminate physical interference but require a larger workload.
(2) Ionization interference.
Since the sample in the ICP is evaporated, dissociated, ionized, and excited in the channel, the changes in sample composition have little effect on the electrical parameters of the high-frequency skin effect. Therefore, the influence of easily ionizable elements on the intensity of ion lines and atomic lines is smaller than that of other light sources. However, experiments show that this easily ionizable interference effect still has a certain impact on spectral analysis.
For vertically observed ICP light sources, appropriately selecting the plasma parameters can minimize ionization interference.
However, for horizontally observed ICP light sources, this easily ionizable interference is relatively more severe. The currently used bidirectional observation technology can effectively address this easily ionizable interference. It is also necessary to maintain a similar composition between the sample solution to be tested and the analytical standard solution.
(3) Matrix effect interference.
The matrix effect originates from the plasma, and for any analytical line, this effect is related to the excitation potential of the spectral line. However, due to the good detection capability of ICP, the analytical solution can be appropriately diluted to keep the total salt content around 1mg/mL. In this diluted solution, matrix interference is often negligible. When the concentration of the matrix substance reaches several milligrams per milliliter, the matrix effect cannot be completely ignored. The matrix effect of the ICP light source is slightly more severe when observed horizontally. Matrix matching, separation techniques, or standard addition methods can eliminate or suppress the matrix effect.
Copywrite @ Sobling.Jewelry — Custom jewelry manufacturer, OEM and ODM jewelry factory