Instrumente de control al calității și echipamente utilizate în producția de bijuterii
A Comprehensive Guide to Quality inspection Tools and Equipment
Introduction
During the quality inspection process of jewelry production, various instruments, equipment, and tools are needed to complete the inspection tasks. Mastering these inspection methods is essential for quality inspectors. According to the evaluation methods of jewelry quality, the main inspection contents of jewelry product quality include the following aspects.
(1) Precious metal content: that is, the content of precious metals;
(2) Gemstone quality: including the authenticity and grade of gemstones;
(3) Weight: including the weight of precious metals, the weight of gemstones, etc.;
(4) Dimensions: including the size and shape of the jewelry;
(5) Appearance quality: including printing, patterns, smoothness, brightness, color, etc.;
(6) Performance: such as metal strength, plasticity, wear resistance, embedding stability, impact resistance, torsion resistance, corrosion resistance, anti-discoloration performance, etc.;
(7) Safety: skin allergies, metal toxicity, carrying bacteria, etc.
Therefore, the instruments and equipment used during the inspection are mainly selected based on the above inspection contents.
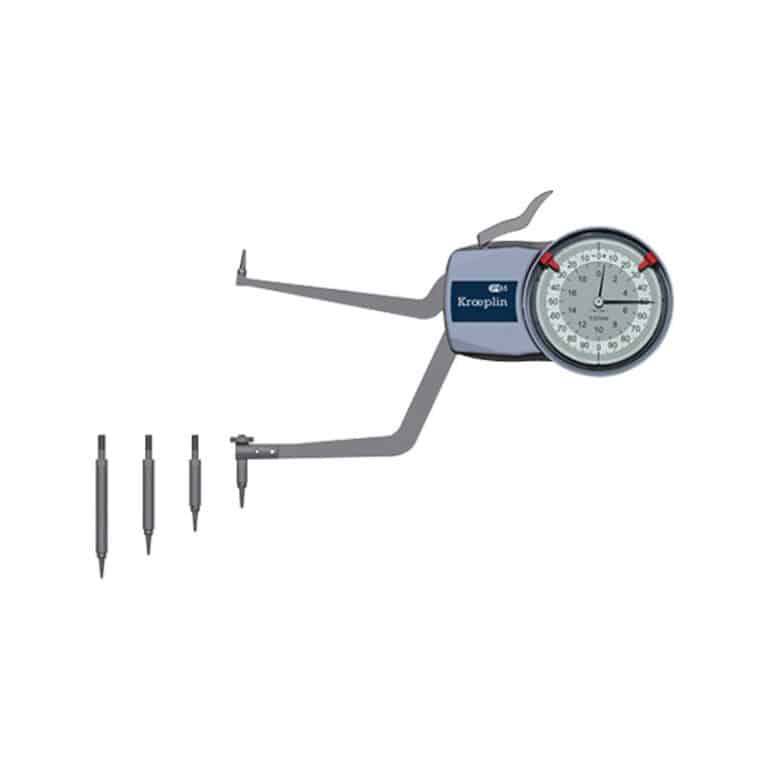
Tabla de conținut
Section 1 Commonly Used Color Quality Inspection Instruments and Equipment
In producing precious metal jewelry, controlling the fineness is an important aspect of quality control, and inspection must be strengthened. Common methods for fineness inspection include the cupellation method and X-ray fluorescence spectrometry.
1. Cupellation Method
The cupellation method is a classic method for analyzing precious metals, which involves enriching the precious metals in the material using fire assay and then determining their content separately. The principle is to add an appropriate amount of silver to the sample to be tested, using lead as a collecting agent, place it in a porous cupel, and oxidize it in a high-temperature furnace. The cupel absorbs lead oxides and impurities, while gold and silver are retained and melted into precious metal beads. These are then hammered flat, rolled into small coils, and placed in nitric acid to separate the silver, and the mass of gold is obtained. At the same time, standard gold is used for comparative analysis to eliminate systematic errors in the analysis process.
The cupellation method has wide applicability and high accuracy, making it the standard method for determining precious metals in various materials. It is also the inspection method used when there are disputes between supply and demand parties regarding fineness, and arbitration inspection is required. However, the cupellation method involves three steps, material preparation, melting, and parting, to complete the separate determination of gold and silver, making it a destructive test unsuitable for the fineness testing of finished jewelry. Additionally, it has drawbacks, such as a long analysis cycle and high analysis costs.
To detect gold content using the cupellation method, it should be carried out following “ISO11426:1997, Determination of gold in gold jewelry alloys – Cupellation method (Fire assay)” or GB/T 9288 – 2006 “Determination of gold content in gold alloy jewelry – Cupellation method (Fire assay)” requirements.
The main instrumentation used in the cupellation method of gold testing, mainly includes the following aspects:
(1) Ultra-micro balance.
Used for weighing the mass of samples, with a sensitivity of 0.01mg and a precision level of class two, specific details can be found in the electronic balance section of this chapter.
(2) High-temperature assay furnace.
Mainly used for melting samples and roasting crucibles, it is required to provide a continuous oxidizing atmosphere with a maximum temperature of 1300℃ and a temperature control accuracy of ±20℃.
(3) Crusher.
Mainly used for crushing samples.
(4) Ashtray.
The performance of the ashtray can vary in the absorption rate of samples and impurities, which also affects the determination of gold and silver content using the ashtray method, significantly undermining the accuracy and reliability of the results. During production, bone ash material ashtrays or magnesia material ashtrays can be selected. Ashtrays come in various shapes, including cylindrical and plate-shaped. The former has been used more in the past, with a diameter of 22mm, capable of absorbing 6 grams of lead, or 26mm, capable of absorbing 10 grams of lead; plate-shaped ashtrays have similar absorption capabilities. Currently, advanced gold testing institutions in Europe and the United States and precious metal testing institutions in Hong Kong, Macau, Taiwan, and Singapore all use this type of plate-shaped ashtray.
In addition, during the gray blood method analysis, tools such as porcelain crucibles, gold separation flasks, stainless steel tongs, stainless-steel tweezers, iron anvils, hammers, tablet presses, nylon brushes, and reagents like nitric acid, lead foil, silver, and standard gold are also used. The gold content of the material can be calculated using the following formula:

In the formula: WAu is the gold content of the sample ( % ); d is the average loss of standard gold during ashing (g );m1 is the mass of the sample before the ashing value;m2 is the mass of the sample after ashing (g).
2. X-ray fluorescence spectrometer
Each element’s X-ray fluorescence has a corresponding characteristic energy or characteristic wavelength. Therefore, by measuring the energy or wavelength of the X-rays, the type of atom and the composition of the element can be determined. Based on the intensity of the fluorescent X-rays at that wavelength, the content of the corresponding element can be quantitatively measured. X-ray fluorescence is a non-destructive analysis method that does not require any treatment of the analyzed samples, does not take samples, and is not limited by the state, size, or shape of the samples while also being fast in analysis. Generally, a sample’s main and minor elements can be determined within a few minutes, and the broad analysis range allows for identifying all elements in the sample at once.
The X-ray fluorescence spectrometer has two types: energy-dispersive ED-XRF and wavelength-dispersive WD-XRF. The method of generating signals for both types of instruments is the same, and the resulting spectra are also similar. However, WD-XRF uses a spectroscopic crystal to disperse the fluorescent beam, measuring various elements’ characteristic X-ray wavelengths and intensities to determine their content. In contrast, ED-XRF separates the undispersed X-ray fluorescence according to photon energy using a high-resolution sensitive semiconductor detector and multichannel analyzer, measuring the quantity of each element based on their energy levels. Due to their different detection principles, the structure and functions of the instruments also differ. In jewelry enterprises, ED-XRF is generally used for production quality inspection and control, which can meet production needs.
2.1 Several common domestic X-ray fluorescence spectrometers in the jewelry industry
With the continuous advancement of China’s manufacturing technology, several manufacturers of X-ray fluorescence spectrometers have emerged. Their products are relatively widely used in the jewelry industry, including gold testing instruments such as X-1600A, X-3000A, X-3680A, and X-3600E produced by Tianjin Bozhi Weiye Technology Co., Ltd.; the GY-MARS/T series precious metal analyzers produced by Beijing Jingguoyi Technology Development Co., Ltd.; energy dispersive fluorescence spectrometers such as EDX1800, EDX2800, and EDX3000B produced by Jiangsu Tianrui Instrument Co., Ltd.; and gold testing spectrometers such as EXF9600S, EXF9600U, EXF9600, EXF9500, and EXF8000S produced by Shenzhen Xifan Technology Co., Ltd. Taking the Bozhi Weiye X- 3680A gold testing instrument as an example, it uses a low-power small X-ray tube as the excitation source, a high- resolution integrated X-123 semiconductor detection system, combined with various collimators and filters, featuring strong detection capability, high resolution, and short detection time. (Figure 3-1).
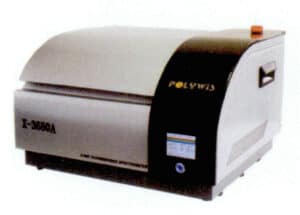
Figure 3-1 Bozhi Weiye X-3680A gold testing instrument
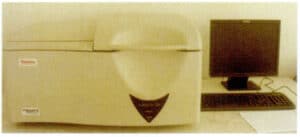
Figure 3-2 American Thermo QUANT' fluorescence spectrometer
2.2 Several common imported X-ray fluorescence spectrometers in the jewelry industry
X-ray fluorescence spectrometers developed and produced by some international brand companies are widely introduced into the domestic market, including Thermo Fisher from the USA, Oxford from the UK, Xenemetrix from the USA, Panalytical from the Netherlands, Seiko from Japan, Amptek from the USA, SPIKE from Germany, Shimadzu from Japan, EDAX from the USA, and Horiba from Japan. Taking the QUANT’X fluorescence spectrometer produced by Thermo Fisher as an example, it has high sensitivity, high precision, and high stability, making it an ideal method for detecting the composition of various metal and non-metal materials, especially suitable for precious metal composition analysis (Figure 3-2). This device is a spectrometer with a Si(Li) solid-state detector, with an elemental analysis range of Na-U and a concentration range of ppm -100%。
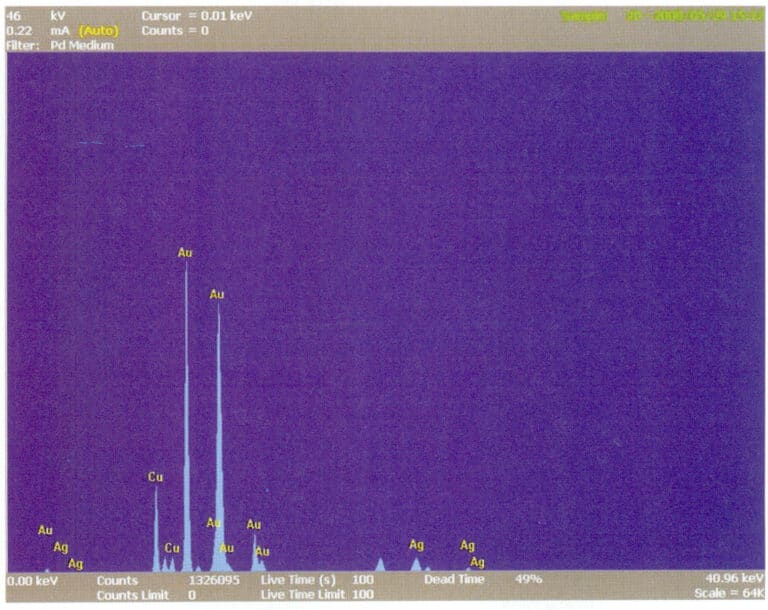
[Case 3-1 ] Using the Thermo Fisher QUANT’ X fluorescence spectrometer to detect the composition of 18K gold.
A working curve is created using a standard sample of the known composition of 18K gold, then the surface of the sample to be tested is cleaned, placed in the designated position in the testing chamber, and the chamber door is closed. Testing parameters are set, and the spectrum is collected (Figure 3-3). After the collection time ends, the device automatically analyzes the results, as shown in Table 3-1.
Table 3-1 Analysis results of the test sample’s composition
| Element | Au | Ag | Cu |
|---|---|---|---|
| Content (wt%) | 75.07 | 12.45 | 12.48 |
2.3 Factors Affecting Measurement Results
Due to the special circumstances of jewelry products and the limitations of the detection method principles, personnel using this method should understand and be familiar with the following factors that affect test results. These influencing factors can significantly impact the collection of characteristic spectral line intensity under different conditions, even leading to misjudgment.
2.3.1 The performance of the machine itself.
The hardware facilities of the purchased instrument determine it.
2.3.2 Calibration curve.
Simply put, the calibration curve is the relationship curve between the X-ray intensity of the element and the mass percentage of the element contained in the sample. The calibration curve converts the characteristic X-ray intensity obtained from measurements to concentration. Therefore, the calibration curve has a significant impact on measurement results. It is related not only to the concentration of the element to be measured, the element to be measured, the instrument calibration factor, and the correction value for the absorption enhancement effect between elements but also to the standard samples used to create the calibration curve, whether the calibration curve is offset, and the applicable range of the calibration curve.
(1) Samples were used to create the calibration curve.
X-ray fluorescence analysis is fundamentally a relative measurement, requiring standard samples as measurement references. Therefore, the geometric conditions of the standard samples and the samples to be tested must be consistent. Standard samples should have sufficient uniformity and stability. Suppose the refining process or analysis method of the sample differs from that of the analysis sample. In that case, the values cannot be traced back, and uniformity and stability cannot be guaranteed. Therefore, standard samples with chemical and physical properties similar to the analysis samples should be selected to create the corresponding calibration curve. This includes the range of analysis element content and maintaining an appropriate gradient, and the content of the analysis elements must be determined using accurate and reliable methods. Nowadays, many instrument manufacturers, to enhance market competitiveness, often pre-draw some general calibration curves based on the type of materials the user wants to analyze before the instruments leave the factory to reduce the need for standard samples during on-site analysis. However, it is undeniable that since these are general curves, they are highly versatile, making it difficult to achieve “precision” simultaneously. Therefore, to ensure the accuracy of the analysis, it is better to have one set of standard samples corresponding to one substrate.
(2) Offset of the working curve.
The general curve is prepared when the instrument is manufactured or at the beginning of operation. Still, it can only be determined on-site whether it is consistent with the original state. It is unlikely to redraw the working curve for every analysis, so periodic checks with traceable standard samples are required to verify whether the working curve has shifted. If a shift occurs and the amount is within the specified allowable range, the working curve needs to be calibrated. The working curve must be redrawn if the shift exceeds the allowable range.
(3) Applicable range of the working curve.
When selecting a working curve, attention should be paid to its applicable range, generally within the concentration range of the standard samples used to draw the curve. For example, if the concentration of the standard sample used to draw the curve is 500 -1000/ug/g, the content of the element to be tested in the sample should be within 500 – 1000/ug/g. If the test point falls outside the extension of the working curve, it will also introduce errors in the measurement results.
2.3.3 Morphology and size of the test sample.
These include the following:
(1) Shape and size of test samples
According to the spot size of the X-ray fluorescence spectrometer, if the spot can completely cover the sample and the sample thickness meets the requirements, it can be directly placed in the testing chamber for measurement; if the spot cannot completely cover the sample, meaning the sample is smaller than the spot, it needs to be placed in a sample cup, reaching a certain amount, then compacted without leaving gaps, and then analyzed. Thin samples (samples that X-rays can penetrate) should be stacked together to achieve the minimum sample thickness limit for effective analysis. The morphology of the test sample can vary; solid samples can have their testing surface polished smooth, and the polished surface should not be touched by hand to avoid oil contamination, which would affect measurement accuracy. Powder samples can be placed in a sample cup or prepared using a tablet. Liquid samples should be poured into a specific sample cup, sealed with special sealing materials, and placed in the testing chamber for measurement.
(2) Homogeneity of the sample.
Non-homogeneous samples often show oil stains or heavy metal contamination on the surface or have coatings or electroplated layers. The former should have these oil stains or heavy metals removed before measurement. Before testing, the latter should have the surface coating scraped off as much as possible. When there are multiple solder points on the jewelry, it can also affect homogeneity.
(3) Influence of the sample surface.
The sample surface is exposed to air and oxidizes. At the same time, the X-ray fluorescence spectrometer is a surface analysis method, which may cause the analysis results of the sample to show a continuously increasing trend over time. The oxidized film should be ground off before measurement, and the gloss level of the sample surface also significantly impacts the analysis results. If the sample surface is not smooth and has unevenness, it will affect the measurement results, so the surface should be smoothed as much as possible.
(4) Influence of interfering elements.
Due to the presence of interfering elements, the spectral lines of the interfering elements overlap with those of the elements to be measured during sample analysis, resulting in an overestimation of the measured intensity and introducing bias into the analysis results. Generally speaking, it is relatively easy to observe the interference of elemental spectral lines; first, one must understand the positions of some common and easily interfering elemental spectral lines and the nature of the interference. A key point in judging the test spectrum of the sample is that if a certain element is present, it should have multiple spectral lines existing simultaneously at various positions. To overcome the influence of interfering elements, one should select non-interfering spectral lines for analysis, appropriately choose the instrument measurement conditions, improve the instrument’s resolution, and perform digital correction, lowering the X-ray tube voltage below the excitation voltage of the interfering elements to prevent the generation of interfering element spectral lines.
2.4 X-ray fluorescence analysis testing methods and requirements
This method should be used for detection following the national standard GB/T 18043-2008 “Determination of Precious Metal Content by X-ray Fluorescence Spectrometry.”
(1) Instrument Calibration:
Calibration should be performed according to the specific requirements of the instrument.
(2) Testing Conditions:
The environmental conditions of the laboratory must meet the requirements of the corresponding instruments; measurements can only be taken when the instrument has reached a stable state.
(3) Testing Method:
At least three testing points must be selected, and the measurement value should be the average of all measurement results.
2.5 Selection of X-ray Fluorescence Spectrometers
Various energy-dispersive fluorescence spectrometers, whether international or China-produced, have different technical levels but are sufficient to meet RoHS testing requirements. Users should choose between international or China based on their capabilities, referring to the following principles: meeting requirements, excellent performance, and low purchasing cost.
2.5.1 Meeting usage requirements is the most basic element.
Filters are required to filter the samples accurately and correctly. There are three types: qualified, unqualified, and uncertain, and it should minimize the uncertain part as much as possible while ensuring the established accuracy and detecting as quickly as possible.
2.5.2 Performance is a very important indicator for evaluating spectrometers.
The detection stability of the spectrometer is affected by factors such as X-ray tube aging, ambient temperature, and power fluctuations. A spectrometer with excellent performance has high detection precision and good accuracy. A spectrometer with poor performance may fail to distinguish lead from arsenic, and the characteristic spectral lines of cadmium may overlap with the characteristic spectral lines of the rhodium electrode in the X-ray tube, leading to misjudgments, errors, or inability to determine, which inevitably results in significantly increased costs and risks. Some spectrometers have serious X-ray leakage, endangering the safety of the operator. Therefore, when purchasing X-ray fluorescence spectrometers, several key performance factors need to be considered, including:
(1) The electrode material of the X-ray tube.
X-ray fluorescence spectrometers use rhodium target X-ray tubes, with a few using tungsten target X-ray tubes. The characteristic spectral lines of rhodium ( Rh ) overlap with the characteristic spectral lines of cadmium; the emission intensity of the rhodium electrode is not high enough, making it inadequate for cadmium detection. The characteristic spectral lines of the tungsten (W) target are far from the characteristic spectral lines of the 5 RoHS elements, with no spectral line overlap; the emission intensity is high, which can improve the detection limit for elements.
(2) Detectors.
Early spectrometers used liquid nitrogen-cooled detectors, which consumed liquid nitrogen each time and were inconvenient. After electrically cooled Si-PIN detectors emerged, they became the mainstream spectrometer detectors. Some brands of electrically cooled detectors have almost reached the ppb level, but their sensitivity for detecting light metal elements could be better. Therefore, SDD electrically cooled detectors were developed to improve sensitivity for light metal elements and can also detect non-metal elements like silicon. However, older SSD detectors are silicon-lithium detectors with large drift and low detection sensitivity. In contrast, the new SDD detectors are high-purity silicon detectors with good stability and high detection sensitivity.
(3) Detection methods and software.
This includes the FP method, the partial calibration line method, and the corrected relative calibration line method. The first two methods have poor stability, while the latter can automatically compensate for the effects of environmental condition changes, X-ray tube aging, power supply variations, and other factors on detection data.
(4) X-ray beam spot diameter.
Currently, the spot diameter ranges from 0.1mm to 15mm. A small spot is not limited by the sample area, while a large spot is less affected by material inhomogeneity. The spot’s size indirectly reflects the X-ray beam’s energy efficiency. Large spots (from a few millimeters to over ten millimeters) usually use collimators to shape the beam, wasting the obstructed part; small spots below 1mm use conduits to shape the beam, resulting in less energy loss. The size of the spot is chosen based on actual measurement needs, and energy loss from the beam is usually compensated by manufacturers in software, filters, and other aspects.
2.5.3 Cost.
Buyers need to thoroughly understand the spectrometer; they should look at the price, usage costs, and maintenance expenses after purchase. Usage costs are implicit costs that are often overlooked but far exceed the quoted price. The usage costs reflected in the spectrometer are manifested in the following aspects:
(1) Detection speed.
This reflects the economic efficiency of direct costs such as labor hours, instrument depreciation, and project progress.
(2) Sensitivity.
This determines the screening range and whether reducing or eliminating physical and chemical analysis is possible.
(3) Service life.
For example, a device rated for 5000 hours of service life, working 8 hours a day, with an effective radiation excitation time of about 2 hours, translates to an effective working time of 8 years. Due to different measurement mechanisms, the service life can vary significantly. A sample only needs to excite the X-ray tube once on this spectrometer, while it requires three excitations on that one. The service life is less than three years on the spectrometer, which requires three excitations.
(4) Operating costs.
Simplicity and complexity of operation can lead to differences in operating costs, including operator training and salaries.
(5) Maintenance costs.
Some spectrometers require detectors to be equipped with a liquid nitrogen cooling system, while others only need simple Peltier cooling. Additionally, some spectrometers often require calibration during operation, while others automatically calibrate before each measurement. The maintenance costs between them are different. The timeliness and completeness of after-sales service are essential to ensure the efficient operation of the equipment and maximize its potential. Loss of work time may lead to unexpected cost increases.
2.5.4 Safety.
The fundamental starting point of the RoHS regulations is environmental protection and health; instruments with no X-ray leakage can ensure personal safety. Data is the final detection result; data preservation and fidelity are always the top priority.
2.5.5 Other aspects.
Small and lightweight, the software has expandable uses and can meet the testing needs of larger samples.
Section II Commonly Used Gem Quality Inspection Instruments and Equipment
To identify finished gemstones, it is essential to identify the tested gemstones without damaging their integrity. For production enterprises, it is generally equipped only with commonly used small gemstone identification instruments, such as gemstone tweezers, pen-type spotlight flashlights, magnifying glasses, dichroscopes, refractometers, ultraviolet fluorescence lamps, Charles filters, gemstone microscopes, thermal conductivity meters, etc. For professional testing institutions, absorption spectrometers, infrared spectrometers, X-ray diffractometers, electron probes, and others are also frequently used.
Section III Commonly Used Weight Inspection Equipment
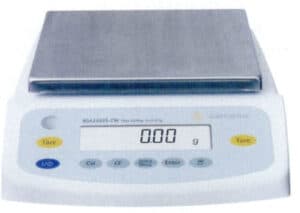
The weight of jewelry is generally very light and involves precious gemstones and metals; therefore, the instruments used for weight detection require high precision and must quickly and reliably obtain the desired results during production. Traditional mechanical weighing instruments cannot meet these requirements, and electronic balances, commonly known as “electronic scales,” are now used for weighing, as shown in Figure 3-4.
1. The Principle of Electronic Balances
Electronic balances use the principle of electromagnetic force to balance the weight of an object for weighing, connecting the weighing pan to a powered coil. When the object to be weighed is placed on the pan, the gravitational force acts downward, generating an electromagnetic force in the coil that is equal in magnitude and opposite in direction to the weight. At this point, the sensor outputs an electrical signal, which is rectified and amplified, changing the current in the coil until it returns to its original position. The current strength is proportional to the weight of the object being weighed. The mass of the material produces this weight, and the analog system processes the resulting electrical signal to display the object’s weight. Compared to mechanical balances, electronic balances have advantages such as fast weighing speed, high resolution, good reliability, simple operation, and diverse functions.
2. Types of Electronic Balances
Electronic balances are generally classified according to accuracy and range, mainly into analytical and precision balances.
Analytical balance:
This includes ultra-microelectronic, microbalances, semi-micro, and standard electronic balances, with a weighing range from a few grams to 200g and a resolution of up to 10-5-10-6.
Precision balance:
This is a general term for electronic balances with an accuracy level of Class II, with a weighing range from several tens of grams to several kilograms and a resolution of up to 10-2-10-4.
3. Selection of electronic balances
When choosing an electronic balance, it is important to consider a number of aspects
(1) Accuracy level.
The accuracy level of electronic balances can be measured in absolute and relative terms. Some electronic balances indicate relative accuracy, but for enterprises, choosing absolute accuracy (graduation value e ) is more intuitive, such as 0.1mg accuracy or 0.01g accuracy. The stability, sensitivity, correctness, and invariance of the electronic balance readings should also be considered. Stability refers to the stability of the balance’s accuracy; sensitivity refers to the speed of response of the balance’s readings; correctness refers to the accuracy of the readings; and invariance refers to the fluctuation range of the readings, with a smaller fluctuation range indicating better invariance.
(2) Range.
Choose an appropriate maximum weighing capacity based on production needs, usually taking the maximum load plus a slight safety factor; bigger is not always better. In jewelry production, the range for weighing gemstones in carats is generally within 500ct; for weighing precious metals with electronic scales, the range is generally within 3200g.
(3) Functionality.
When electronic balances have certain functions, they can bring convenience to production. For example, reliable readings can be easily obtained through the display; they can be connected to printers; they can perform piece counting, percentage weighing, etc.; they can switch between several commonly used weighing units in the jewelry industry (including carats, grams, ounces, Hong Kong taels).
(4) Cost-effectiveness.
Price is also an important consideration, provided that the performance requirements are met.
World-renowned electronic balance brands include Mettler-Toledo from Switzerland, Setra from the USA, Precisa from Switzerland, Sartorius from Germany, and Android from Japan ( A&D)
4. Use and Maintenance of Electronic Balances
(1) An electronic balance should be placed on a stable workbench to avoid vibrations, air currents, and direct sunlight.
(2) Level adjustment.
Observe the level gauge; if the bubble is off-center, adjust the leveling feet to position the bubble in the center of the level gauge.
(3) Preheating.
Turn on the power and preheat for the specified time before turning on the display for operation.
(4) Selection of the basic mode of the balance.
The setting of the weighing unit and other operations can be performed according to the manual.
(5) Calibration.
After installation, the balance should be calibrated before its first use. Due to long storage time, movement, environmental changes, or lack of precise measurements, calibration is generally required before using the balance.
(6) Weighing.
Press the TARE button, and after it displays zero, place the weighing item on the scale pan. Wait for the number to stabilize, and when the “0” indicator in the lower-left corner of the display disappears, you can read the mass value of the weighing item. When weighing corrosive items, they should be placed in a sealed container to avoid damaging the electronic balance; do not overload the scale during weighing to prevent damage.
(7) Tare weighing.
Press the TARE button to zero, place the container on the scale pan, and the balance will display the mass of the container. Press the TARE button again to display zero, thus removing the tare weight. Then, place the weighing item in the container or gradually add the weighing item (powder or liquid) to the container until the desired mass is reached. Wait for the “0” in the lower-left corner of the display to disappear; at this point, the display shows the net mass of the weighing item.
(8) After weighing is complete, turn off the display and disconnect the power.
The electronic balance should be periodically calibrated according to the regulations of the metrology department, and it should be kept by a designated person responsible for maintenance to ensure it is in optimal condition. The main content of periodic calibration includes the sensitivity and discrimination of the balance, the maximum allowable error at each load point (weighing linear error), repeatability, eccentric load or corner error, and balancing function etc. After calibration, a calibration certificate or label should be issued based on the actual calibration results.
Section IV Commonly Used Appearance Quality Inspection Instruments and Equipment
Jewelry has high requirements for appearance quality, so appearance quality inspection has become an important inspection content in the production process. The overall effect can only be observed with the naked eye, and to quantify the appearance effect or to deeply observe surface defects, some necessary instruments, and equipment are needed, including colorimeters, magnifying glasses, stereo microscopes, and scanning electron microscopes.
1. Colorimeter
In the past, the jewelry industry generally relied on the naked eye to judge the color of alloys, which had a high degree of subjectivity. Disputes and returns often arose between jewelry companies and customers due to inconsistent color judgments. To reduce these issues, the jewelry industry has taken some measures. For example, some manufacturers have created a series of color samples, which are confirmed by customers before mass production according to the confirmed color samples; some manufacturers have recognized the impact of light sources on color judgment and have improved and adjusted the inspection of light sources. Some companies have introduced standard light boxes, stipulating inspections at certain color temperatures and distances. These measures have improved the variability of color inspection to some extent, leading to a rapid promotion in the jewelry industry. However, since color judgment still relies on the naked eye, subjectivity and variability are inevitably introduced. In recent years, a few companies in the industry have begun to introduce colorimeters ( (Figure 3-5)) to quantitatively detect the colors of color samples and products and conduct a certain proportion of random inspections in daily production, guiding the technical, production, and quality inspection departments in color judgment and improvement, achieving good results.
There are various methods for quantitatively detecting color, among which the most commonly used is the CIELab system, as shown in Figure 3-6. It uses three coordinates, L*, a*, and b*, to describe color, where L* represents lightness, a* represents the red-green color axis, and b* represents the yellow-blue color axis. Any color of the alloy can be represented in three-dimensional color space.
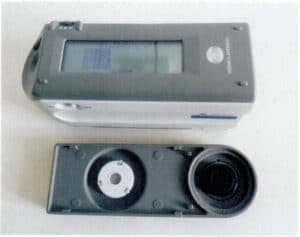
Figure 3-5 CM2600d Colorimeter
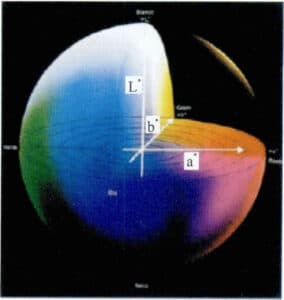
Figure 3-6 CIELab Color Coordinate System
The colorimeter can also quantitatively explain the color differences of alloys. If the color coordinates of two alloys are L1*, a1*, b1* and L2*, a2*, b2*, then the color difference △E between them is:

When using a colorimeter to detect the color of jewelry, factors such as the structure and accuracy of the device itself, inspection conditions, and sample conditions will also affect the detection results.
[Case 3-2] Using a colorimeter to test the color change resistance of high-strength pure gold.
The method is as follows: Roll the pure gold nugget into a sheet, cut a sample of size 10x10x1mm, polish the sample’s surface, degrease, clean, and dry it. The CM2600d was used to test the initial color of the sample, measuring it three times and taking the average. Soak the sample in artificial sweat for the color change test, with the ratio and parameters of the artificial sweat being: CO(NH2)21.00 ± 0.01 g/L, NaC15.00 ± 0.05 g/L, C3H6031.00 ± 0.01 g/L, and the rest being freshly prepared deionized water, adjusting the pH value to 6.5 ± 0.05 with a dilute solution of NaOH at 0.1%. During the soaking process, take out the sample at regular intervals to detect color changes, plot the color index change curve as shown in Figure 3-7, and calculate the color difference using formula △E above, plotting the color difference change curve as shown in Figure 3-8.
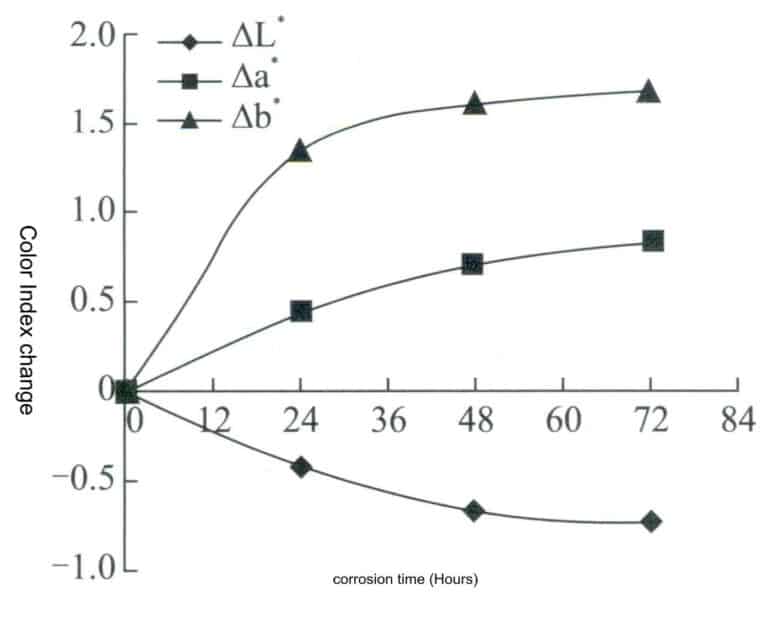
Figure 3-7 Change rate of the color index of the sample after soaking in artificial sweat
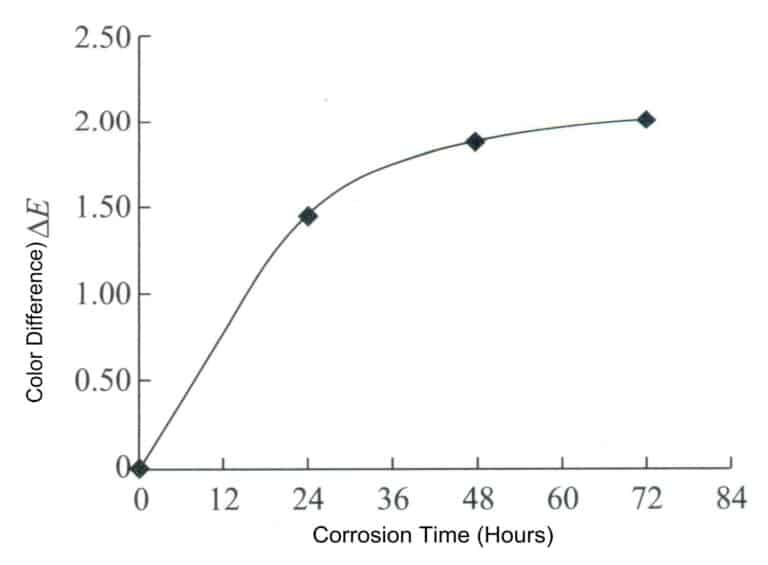
Figure3-8 Change rate of color difference △E of the sample after soaking in artificial sweat
It can be seen that with the extension of corrosion time, the brightness value L* of the material slightly decreases, while the* value and b* value slightly increase, indicating that the surface of the material gradually becomes dull, and the color gradually turns yellow and red. However, overall, the change in the color difference of the material is very small, demonstrating excellent anti-discoloration performance.
2. Magnifying Glass
In the quality inspection of jewelry appearance, it is necessary to inspect the quality of detailed parts, and the human eye has a very low ability to discern the details of objective objects, generally within 0.15 – 0.30mm range, so it is essential to use observation tools such as magnifying glasses and microscopes.
A magnifying glass is a simple visual optical device used to observe the details of objects. It is a converging lens with a focal length much smaller than the eye’s near point. The principle of magnification is that the size of the image formed on the human eye’s retina is proportional to the angle subtended by the object at the eye (visual angle). The larger the visual angle, the larger the image, and the more details of the object can be distinguished.
When using a magnifying glass, one hand holds the magnifying glass close to the front of one eye. In contrast, the other hand uses the index finger and thumb to hold the jewelry and bring it close to the magnifying glass until the desired part of the jewelry can be observed. Bringing the object closer can increase the visual angle, but the eye’s focusing ability limits it. The most commonly used magnification in the jewelry industry is ten times, as shown in Figure 3-9. It consists of three lenses, and a qualified magnifying glass should have high clarity and be able to eliminate spherical and chromatic aberration that affect the observation of gemstones.
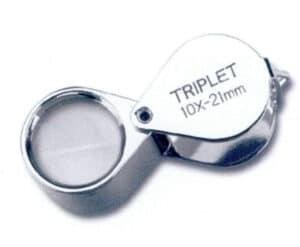
Figure 3-9 Magnifying glass for jewelry inspection
3. Stereomicroscope
The stereomicroscope is a visual instrument that provides a three-dimensional view with a correct image. Its optical structure principle involves a shared primary objective lens, where two light beams formed after imaging the object are separated by two sets of intermediate lenses (also known as zoom lenses) at a certain angle, referred to as the stereoscopic angle, generally 12-15 degrees. Each beam forms an image through its eyepiece, providing a three-dimensional image for the left and right eyes. The magnification can be adjusted accordingly by changing the distance between the intermediate lens groups. The stereo microscope can be used only for microscopic observation through the eyepiece. Still, it can also be connected to various digital interfaces, digital cameras, video cameras, electronic eyepieces, and image analysis software to form a digital imaging system connected to a computer, allowing real-time dynamic images to be observed on a display screen and enabling the editing, saving, and printing of required images, as shown in Figure 3-10.
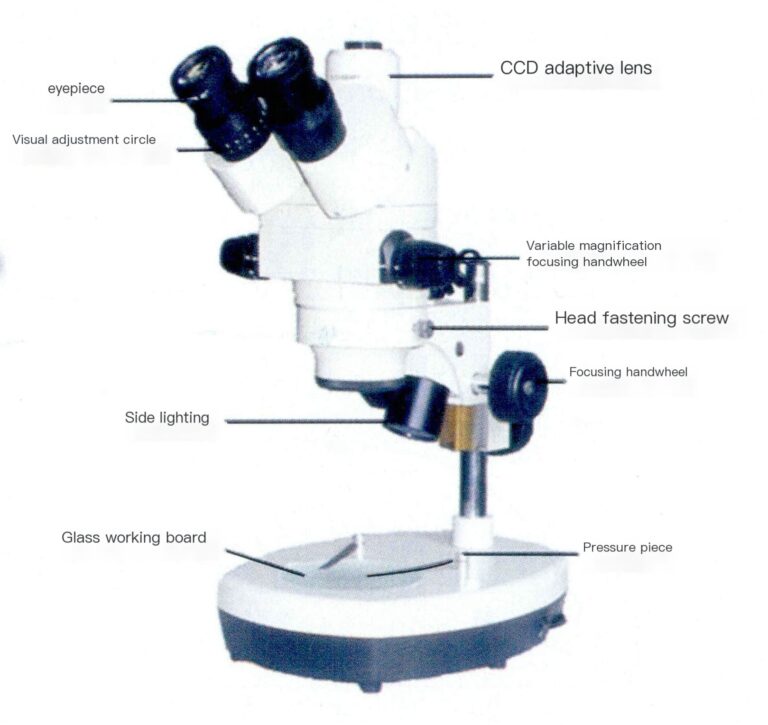
Figure 3-10 Stereomicroscope with digital imaging system
The stereomicroscope has the following characteristics:
(1) Large field diameter and great depth of focus, making it easier to observe all layers of the object being inspected;
(2) Although the magnification is not as high as that of conventional microscopes, its working distance is very long;
(3) The prism below the eyepiece inverts the image, making it upright and easier to operate.
The typical technical parameters of the stereomicroscope for jewelry inspection are as follows: eyepiece magnification 10x, field of view Φ20mm; the objective lens uses a rotating drum for continuous zoom, with a range of 0.7 -4.5 times; the total magnification is 7-45 times; the zoom ratio is 6.5:1.
[Case 3-3] Two diamonds showed cracks in the multi-stone pavé setting.
Observing with a stereomicroscope allows for a clear view of the damaged areas and severity and facilitates easy recording, as shown in Figure 3-11.
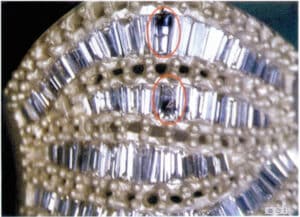
Figure 3-11 The condition of the damaged stone observed with a stereomicroscope
4. Metallographic Microscope
The metallographic microscope is mainly used to examine the size, shape, distribution, quantity, and properties of the microstructure of metals and alloys, to investigate the relationship between alloy elements, compositional changes, and their effects on microstructural changes, the patterns of changes introduced by hot and cold processing; it can also be used for surface micro-condition inspection, quality control, and failure analysis of products, among other applications. It features good stability, clear imaging, high resolution, and a large, flat field of view.
The optical system of the metallographic microscope consists of two stages. The first stage is the objective lens, which produces an enlarged, inverted real image that is still very small and cannot be discerned by the human eye, thus requiring a second magnification. The second stage of magnification is achieved through the eyepiece; when the inverted real image magnified by the first stage is within the focal point of the eyepiece, the human eye can observe the second enlarged erect virtual image through the eyepiece. Metallographic microscopes are classified into upright and inverted types depending on the orientation of the sample observation surface.
The digital metallographic microscope system integrates traditional optical microscopes with computers and digital cameras through photoelectric conversion, allowing for microscopic observation through the eyepiece and real-time dynamic image observation on a computer (digital camera) display screen. It also enables the editing, saving, and printing required images, as shown in Figure 3-12.
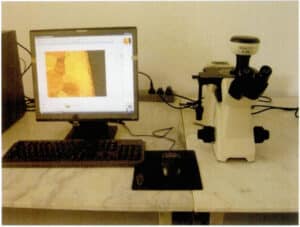
Figure 3-12 The digital metallographic microscope system
Common technical parameters of metallographic microscopes include: the eyepiece magnification is usually ten times; the objective lens magnifications are 4 x, 10 x, 20 x, 40 x, 60 x, 80 x, or 100 x; the total optical magnification is 40 x, 100 x, 200 x, 400 x, 600 x, 800 x, or 1000 x.
[Case 3-4] A factory found that the ring produced using annealed profiles exhibited an orange peel surface after polishing, making it difficult to achieve a qualified state, as shown in Figure 3-13.
To understand the reason, a metallographic microscope was used to observe the metallographic structure of the material, revealing abnormally coarse grains, as shown in Figure 3-14. Investigating the annealing process of the material, it was found that a high-temperature annealing of 800℃ was used, which is evidently, this temperature is too high for 18 K. When annealing the profile, using an excessively high annealing temperature or an overly long annealing time causes the grains to grow excessively, and a coarse grain structure is detrimental to achieving a good polished surface.
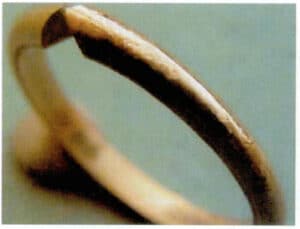
Figure 3-13 The surface of the ring shows an orange peel state after polishing

Figure 3-14 Excessively high annealing temperature leads to coarse grains
5. Scanning Electron Microscope
Scanning electron microscopy is a multifunctional instrument with many superior performances, capable of observing and analyzing the three-dimensional morphology of materials, micro-area composition analysis, analysis of product defect causes, etc. It is now widely used in materials science, product quality identification in industrial production, and production process control, becoming one of the indispensable instruments in quality control across various production departments in materials science.
5.1 Working principle of scanning electron microscope
As shown Figure 3-15, from the cathode of the electron gun issued by the diameter of 20 ~ 30nm of the electron beam, by the cathode and anode between the accelerating voltage, shot to the mirror barrel, through the condenser mirror and the objective lens of the convergence effect, narrowed into a diameter of about a few millimeters of the electron probe. Under the action of the scanning coil on the upper part of the objective lens, the electron probe makes a grating scan on the sample surface. The scanning coil on the top of the objective lens scans the surface of the sample in the form of a grating and excites a variety of electronic signals. These electronic signals are detected by the corresponding detector, amplified, converted, turned into voltage signals, and finally sent to the gate of the picture tube, and modulation of the brightness of the picture tube. The electron beam in the tube in the fluorescent screen also for raster scanning, this scanning movement and the sample surface of the electron beam scanning movement is strictly synchronized, so that the degree of liner and the received signal strength corresponding to the scanning electron image, this image reflects the sample surface topographic features.
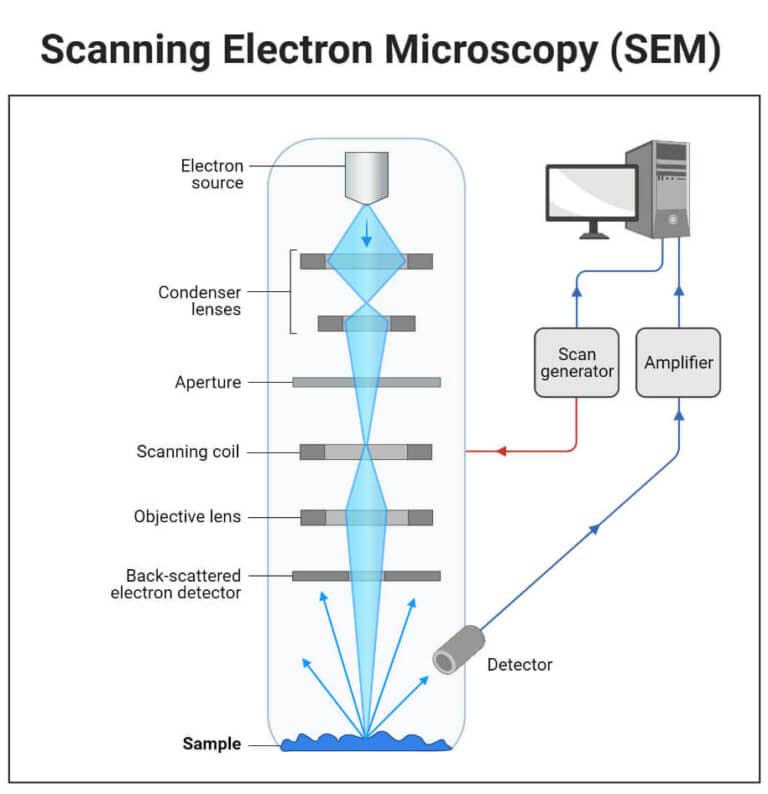
Figure 3-15 Working principle of scanning electron microscope
5.2 Structure of the Scanning Electron Microscope
The structure of the scanning electron microscope includes the following systems.
(1) Electron optical system:
electron gun; condenser lenses (first, second condenser lenses, and objective lens); objective aperture.
(2) Scanning system:
scanning signal generator, scanning amplification controller, scanning deflection coils.
(3) Signal detection and amplification system:
detecting secondary electrons, backscattered electrons, and other electronic signals.
(4) Image display and recording system:
Early SEM used cathode ray tubes, cameras, etc. Digital SEM uses computer systems for image display and recording management.
(5) Vacuum system:
Vacuum level higher than 10-4 Torr. Mechanical vacuum pumps, diffusion pumps, and rotary molecular pumps are commonly used.
(6) Power supply system:
High voltage generator, high voltage oil tank.
5.3 Characteristics of scanning electron microscopes
Compared to optical microscopes and lenses, scanning electron microscopes have the following characteristics: they can directly observe the structure of the sample surface; the sample preparation process is simple and does not require slicing into thin sections; samples can be translated and rotated in three-dimensional space within the sample chamber, allowing observation from various angles; they have a large depth of field, and the images are rich in three-dimensionality. The depth of field of scanning electron microscopes is hundreds of times greater than that of optical microscopes and dozens of times greater than that of transmission electron microscopes; the magnification range is wide, and the resolution is relatively high, falling between that of optical microscopes and transmission electron microscopes; they can magnify from a dozen times to hundreds of thousands of times, essentially covering the magnification range from magnifying glasses and optical microscopes to transmission electron microscopes; the damage and contamination to the sample from the electron beam are relatively low; while observing morphology, other signals emitted from the sample can also be used for micro-area compositional analysis.
【Case 3-5】 In studying the anti-discoloration performance of 925 silver, accelerated corrosion testing is often used, where the test piece is soaked in a potassium sulfide solution of a certain concentration and temperature for a certain period, then taken out to observe the corrosion morphology on the surface.
Figure 3-16 shows the surface corrosion conditions observed under a stereomicroscope, metallographic microscope, and scanning electron microscope. Under the stereomicroscope, it can only be seen that the silver piece has completely turned dark black. Under the metallographic microscope, many micro-corrosion spots can be seen on the surface. Under the scanning electron microscope, it is observed that after long-term corrosion, the surface of the silver piece has formed a severe flower-like corrosion layer, which is loose and porous, losing its protective effect on the substrate.
(a) Stereomicroscope
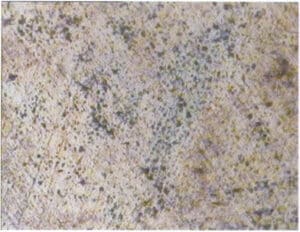
(b) Metallographic microscope
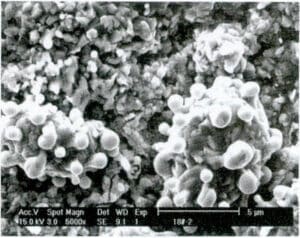
(c) Scanning electron microscope
Figure 3-16 Comparison of surface conditions of 925 silver after soaking in potassium sulfide solution under different microscopes
Section V Commonly Used Size Inspection Instruments and Equipment
In jewelry making and quality inspection, it is often necessary to check various sizes. The inspection tools used include calipers, ring gauges, rulers, and gauges, among which calipers and ring gauges are the most commonly used.
1. Calipers
1.1 Measurement Principles and Reading Methods
A caliper is a measuring instrument used to measure length, inner and outer diameters, and depth. It consists of a main scale and a sliding vernier attached to the main scale, as shown in Figure 3-17. The main scale is generally in millimeters, while the vernier is on 10, 20, or 50 divisions. Depending on the divisions, the vernier caliper can be classified into tenths, twentieths, and fiftieths. The main scale and the vernier have two pairs of movable measuring jaws, which are the internal measuring jaws and the external measuring jaws. The internal measuring jaws are usually used to measure inner diameters, while the external ones are typically used to measure lengths and outer diameters.
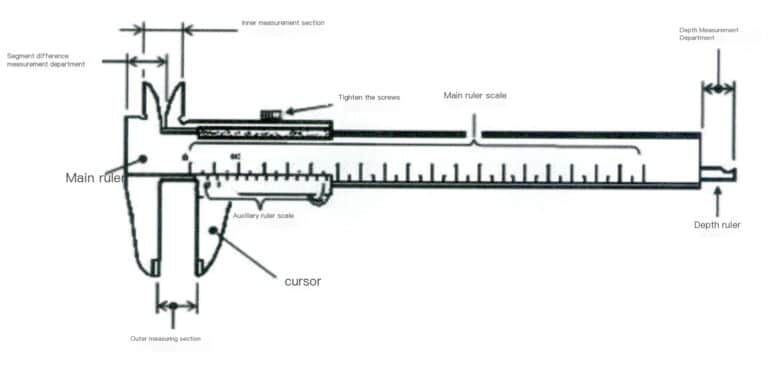
Figure 3-17 Simple Vernier Caliper
Both the main scale and the vernier scale have graduations. When reading, first refer to the zero graduation line of the vernier to read the integer millimeters on the main scale, which is the integer part in millimeters. Then, check which vernier graduation line aligns with the main scale’s graduation line. For example, if the nth graduation line aligns with the main scale graduation line, the reading on the vernier scale is nx the division value. If there is zero error, subtract the zero error from the above result.
In addition to the simple type, common vernier calipers also include pointer type and digital type, as shown in Figures 3-18 and 3-19. The former operates on the principle of using a rack and pinion to convert the linear displacement on the main scale into the angular displacement of the pointer. When the pointer moves one small division, the displacement corresponds to one division value of the caliper. The latter displays the measurement value on a screen, allowing for direct reading.
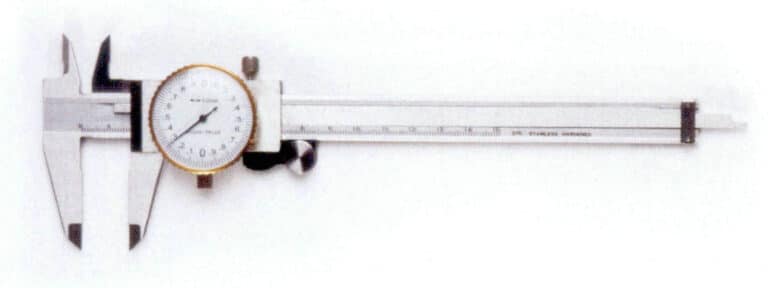
Figure 3-18 Pointer Type Vernier Caliper
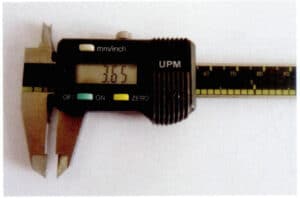
Figure 3-19 Digital Caliper
1.2 Precautions for Use
Before measuring, use a soft cloth to clean the measuring jaws of the caliper, ensuring they are closed. Check if the zero scale lines of the vernier and the main scale are aligned. If they are aligned, you can proceed with the measurement. If not, note the zero error; if the zero scale line of the vernier is to the right of the main scale’s zero line, it is called a positive zero error, and if it is to the left, it is called a negative zero error.
During measurement, first open the movable measuring jaw of the caliper to freely clamp onto the workpiece. Place the part against the fixed measuring jaw, then move the scale frame and apply slight pressure to make the movable measuring jaw contact the part for reading. Be careful not to adjust the two measuring jaws too close to or less than the measured dimension, forcing the jaws onto the part. Doing so may deform the jaws or cause premature wear on the measuring surfaces, resulting in a loss of accuracy.
The line connecting the two measuring surfaces of the caliper should be perpendicular to the measured surface. If there is any tilt, it may lead to incorrect measurement results. Sometimes, you can gently shake the caliper to ensure it is properly aligned vertically.
1.3 Common brands of calipers
Including foreign brands such as Swiss Tesa, German Asimeto, Swedish Clifen, and Japanese Mitutoyo, as well as Chinese brands like HaLiang, ChengLiang, QingLiang, and ShangGong.
2. Ring size
2.1 Method of indicating ring size
The standard for ring size is also known as hand size, usually represented by a number, which is a dimensionless value and cannot be directly equated to specific measurements. Different regions have different methods for indicating sizes, commonly including Hong Kong, American, and Japanese sizes, each corresponding to different diameters and circumferences. Currently, China mostly uses Hong Kong’s size. The corresponding relationships between hand size numbers and measurements in different regions are shown in Tables 3-2.
Table 3-2 Ring Size Comparison Table for Different Countries
| Statele Unite ale Americii | China | Regatul Unit | Japonia | Germania | Franța | Elveția |
|---|---|---|---|---|---|---|
| 5 | 9 | J 1/2 | 9 | 15.75 | 49 | 9 |
| 6 | 12 | L 1/2 | 12 | 16.5 | 51.5 | 11.5 |
| 7 | 14 | O | 14 | 17.25 | 54 | 14 |
| 8 | 16 | Q | 16 | 18 | 56.5 | 16.5 |
| 9 | 18 | S | 18 | 19 | 59 | 19 |
| 10 | 20 | T l/2 | 20 | 20 | 61.5 | 21.5 |
| 11 | 23 | V1/2 | 23 | 20.75 | 64 | 24 |
| 12 | 25 | Y | 25 | 21.25 | 66.5 | 27.5 |
2.2 Measurement of ring size
The hand size is usually measured using a ring sizer, also known as a ring stick, which is a jewelry-specific inspection tool used to measure the size of the inner circle of a ring. It is generally made of brass, aluminum alloy, etc., and has a tapered stick shape. Some ring sizers only indicate the size of a specific country (region), as shown in Figure 3-20. Others label the sizes of different countries (regions) along with their corresponding circumferences and dimensions, such as the four-in-one ring sizer in Figure 3-21, which indicates the sizes commonly used in Hong Kong, the United States, Japan, and Europe.
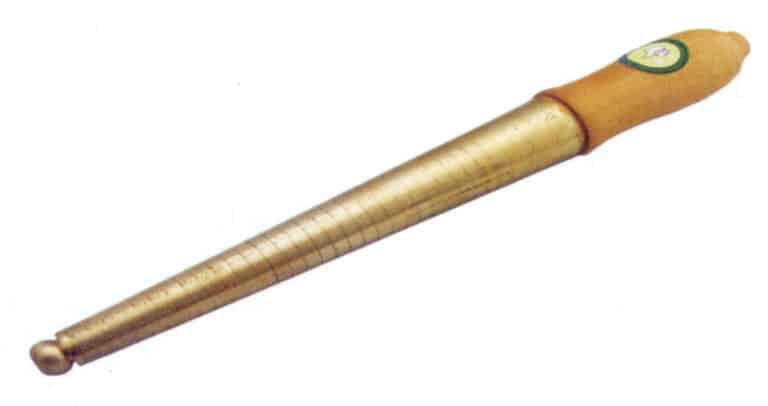
Figure 3-20 Commonly Used HK Ring Ruler

Figure 3-21 Four-in-One Ring Sizer
3. Ring Size
Before customers purchase or custom-make a ring, they need to determine their finger size. One simple method is to wrap a piece of thread around the finger, then cut the thread and straighten it out, measuring its length with a ruler and then comparing it to the previous hand size reference chart. Another method is to use a ring size gauge, as shown in Figure 3-22, which consists of a series of steel rings with different size numbers that can be directly slipped onto the finger to determine the size.
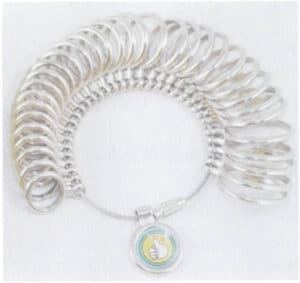
Figure 3-22 Commonly Used Ring Gauges
4. Calipers
During the production process of jewelry prototypes, determining the thickness of various parts of the original model, the width of internal grooves, and other dimensions that cannot be measured with a standard caliper is often necessary. Various gauges must be used, including internal and external gauges. The former is suitable for measuring the inner holes, inner grooves, and other hard-to-measure internal dimensions of workpieces; the latter is suitable for measuring outer circles, outer grooves, and other hard-to-measure external dimensions. Gauges come in various reading forms; simple gauges need to be combined with calipers, rulers, etc., to determine dimensions, while gauges with scales or dials can be read directly, as shown in Figure 3-23.
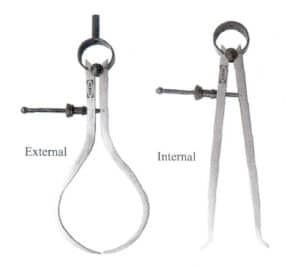
(a) Simple Gauge

(b) Gauge with Dial
Figure 3-23 Various Forms of Soldering Rules
Section VI Commonly Used Physical Performance Testing Instruments and Equipment
1. Water Density Meter
The selection range of alloying elements for soldering is quite broad for precious metal alloys such as gold, silver, platinum, and palladium of the same color. Each alloying element has its atomic mass and corresponding density, and different solder compositions will have different densities. For a piece of jewelry with a fixed volume, if the density of alloys of the same color differs, the amount of precious metal used will also vary. Therefore, testing the density of the alloy is meaningful. Additionally, during the production process, the density of the material can also be used to determine the compactness of the blank.
The density of the alloy is tested using the drainage method, which operates on the principle that the instrument used is a water density meter, mainly including an electronic balance with a sensitivity of over 0.0001g, a suspension frame, a beaker, etc., as shown in Figure 3-24.
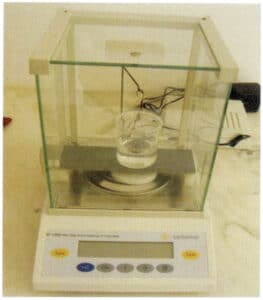
Figure 3-24 Commonly used water densitometer
First, weigh the material in air m1, then weigh the material submerged in water m2, and you can use the formula below to calculate the density of the material:

formula to calculate the density of the material:
[Case 3-6] A jewelry factory needs to accurately grasp the density of wax and metal to calculate the weight of metal based on the weight of the wax tree during mold pouring.
A water densitometer was used to detect both densities, resulting in the data shown in Table 3-4. From this, the ratio of the weight of the metal in the mold to the weight of the wax tree can be calculated as 9.2.
Table 3-4 Results of water density method detection
| Materiale | Weight in air (g) | Weight in water (g) | Calculate density (g/cm3) |
|---|---|---|---|
| Wax block | 2.07 | -0.18 | 0.92 |
| Metal block | 5.24 | 4.62 | 8.45 |
When using the water density method to detect the density of a substance, the following points should be noted:
(1) The static water density detection method can only detect solid jewelry; hollow and inlaid jewelry cannot be accurately detected, resulting in significant errors.
(2)The results are likely to have errors for designs that are prone to retaining air bubbles when submerged in water.
(3) Before measurement, the workpiece must be cleaned thoroughly to avoid oil, dust, and other residues on the surface, as this will affect detection accuracy.
(4) After placing the product to be tested in the basket in the water tank, ensure that any bubbles attached to the surface are removed before testing.
2. Differential Thermal Analyzer
Most jewelry is produced using gypsum mold casting technology, and the filling performance of the molten metal is greatly related to the pouring temperature. The basis for determining the pouring temperature is the alloy’s melting point, which is generally set by adding a certain degree of superheat to the melting point. Additionally, due to the poor high-temperature thermal stability of gypsum, excessively high temperatures of the molten metal can easily lead to thermal decomposition of the gypsum, releasing SO2 gas and causing porosity in the castings. Therefore, to ensure the quality of jewelry castings, it is necessary to control the alloy’s melting point.
When jewelry manufacturing companies purchase alloy materials, suppliers generally provide the alloy’s melting temperature and pouring temperature. If one wants to test the alloy’s melting point but lacks professional testing equipment, a simple and rough method can be to use a casting machine or melting machine with a temperature control device, gradually approaching a certain temperature through a bidirectional melting and solidification method. However, to accurately understand the alloy’s melting point, professional equipment such as a differential thermal analyzer must be used for testing. Figure 3-25 shows a typical differential thermal analyzer. It mainly consists of a heating furnace, differential thermocouple, sample holder, and display instruments for differential thermal signals and temperature. During measurement, small granular samples are placed in the alumina sample holder corresponding to the right-deflected hot end, using aluminum oxide as the reference material, and the sample holder is placed in the center of the heating furnace. The heating rate is set, and during the heating process of the sample, the instrument can automatically record and display the differential thermal curve. From the differential thermal curve, the melting point range of the alloy and the solid-state phase transition temperature range can be accurately determined.
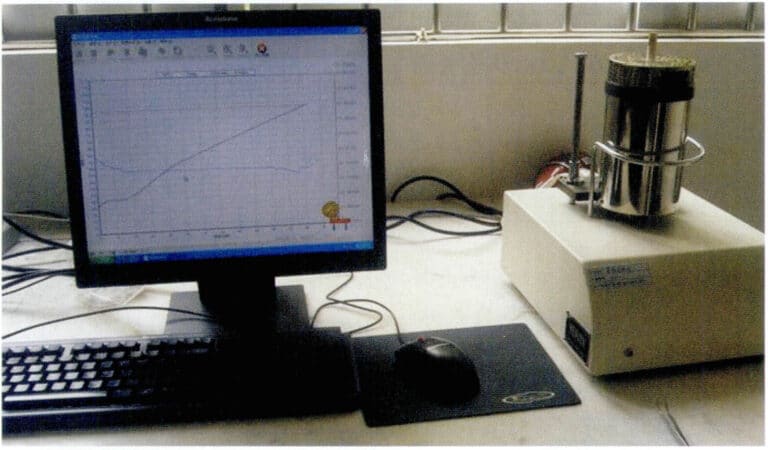
Figure 3-25 Typical differential thermal analyzer
[Case 3-7] Using a differential thermal analyzer to detect the melting temperature of a certain 18 KY alloy prepared for a repair, the data shown in Table 3-5 was obtained, from which it can be seen that the melting temperature range of the alloy is 877.7 – 908.5℃, with an interval of about 31℃, which is favorable for casting.
Table 3-5 Differential thermal analysis characteristic values of a certain 18 KY alloy (Unit: ℃)
| Te | Tg | Tm | Tc |
|---|---|---|---|
| 877.7 | 885.9 | 900.9 | 908.5 |
Note: In the table, Te indicates the temperature at which the substance begins to melt, Tg indicates the temperature at which the substance decomposes to 50%, Tm is the peak temperature at which the substance reaches its melting point, and Tc is the extrapolated termination temperature.
Section VII Commonly Used Chemical Property Testing Instruments and Equipment
The chemical properties of jewelry alloy materials are mainly reflected in their resistance to tarnishing and corrosion, which is very important for jewelry. The chemical properties of jewelry materials or finished products can be detected mainly through electrochemical tests, accelerated immersion corrosion tests, and salt spray corrosion tests.
1. Electrochemical Test
The corrosion of materials is largely manifested as electrochemical corrosion. By detecting the materials’ electrochemical properties, the materials’ corrosion tendency can be reflected.
The electrochemical properties of materials can be determined using an electrochemical workstation, as shown in Figure 3-26. The electrochemical workstation integrates a potentiated signal generator and corresponding control software, allowing for various testing functions such as open circuit potential monitoring, constant potential (current) polarization, dynamic potential (current) scanning, cyclic voltammetry, constant potential (current) square wave, constant potential (current) step, and electrochemical noise monitoring, all under computer control. During the process, real-time plotting can be performed based on the data, allowing for various smoothing and digital filtering of the potential-current curve, and the graphics can be directly output in vector format.
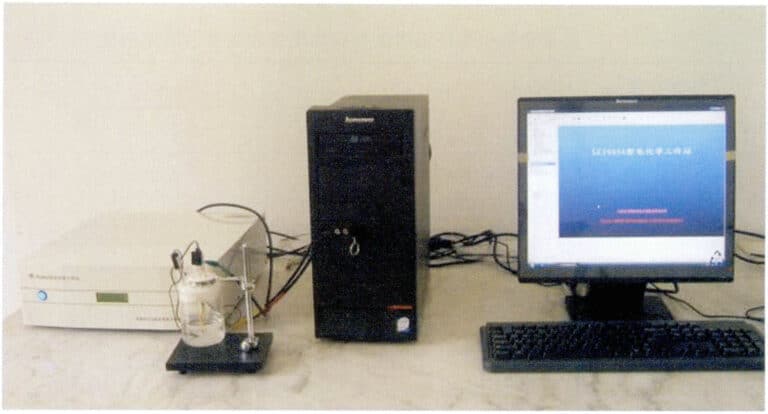
Figure 3-26 Electrochemical Workstation
[Case 3-8] Using an electrochemical workstation to detect the polarization curve of anti-discoloration 925 silver in 37℃ artificial sweat.
A three-electrode system is used during detection, with the working electrode (test surface), reference electrode (saturated calomel electrode), and counter electrode (platinum sheet electrode) placed in the electrochemical cell. The electrolyte is a newly formulated artificial sweat, and the temperature of the sweat is stabilized at 37℃ in a constant temperature water bath. The open circuit potential of the system is measured first, and after the open circuit potential stabilizes, potential scanning begins, and the polarization curve is obtained, as shown in Figure 3-27. From the above figure, the polarization potential and polarization current of each alloy in artificial sweat can be derived, as shown in Table 3-6.
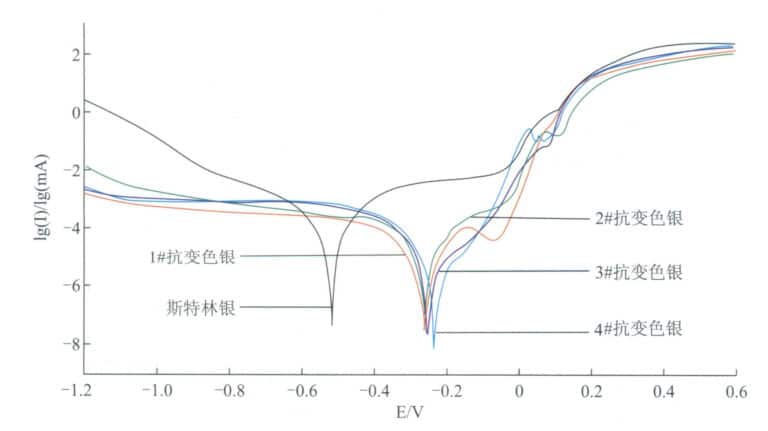
Figure 3-27 Polarization behavior of silver alloys in artificial sweat
Table 3-6 Self-corrosion potential and self-corrosion current density of silver alloys in artificial sweat
| Sample number | Ecorr /mV | Icorr /mA • cm2 |
|---|---|---|
| Argint Sterling | -521 | 2.98E - 04 |
| 1 # tarnish-resistant silver | -253 | 4.20E - 05 |
| 2# tarnish-resistant silver | -247 | 4.36E - 05 |
| 3# tarnish-resistant silver | -250 | 6.86E - 05 |
| 4 # tarnish-resistant silver | -232 | 6.93E - 05 |
It can be seen that compared to traditional sterling silver, the corrosion potential of tarnish-resistant silver Ecorr shifts positively, and the self-corrosion current density decreases, especially for alloys three # and four #, which exhibit lower self-corrosion current densities, reflecting better tarnish resistance.
2. Solution Immersion Test
The tendency of the alloy to darken and tarnish can also be detected using the solution immersion method. The immersion solution can include artificial sweat, sodium sulfide solution, sodium chloride solution, etc. The test piece is suspended in the solution at a certain temperature, as shown in Figure 3-28. After a certain period, it is taken out, and the color changes before and after immersion of the same material, or the degree of discoloration between different materials can reflect the material’s corrosion resistance.
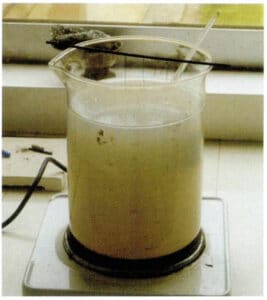
Figure 3-28 Sodium Sulfide Solution Immersion Method
[Case 3-9] A sodium sulfide solution immersion method was used for the experiment to compare the difference in tarnish resistance between tarnish-resistant silver and traditional sterling silver.
The concentration of the sodium sulfide solution is 0.5%, the temperature is 35℃, and after immersing for 2 minutes, the sample is taken out to observe the discoloration status of the surface, as shown in Figure 3-29. The most severely discolored in the figure is sterling silver, while the others are different models of tarnish-resistant silver.
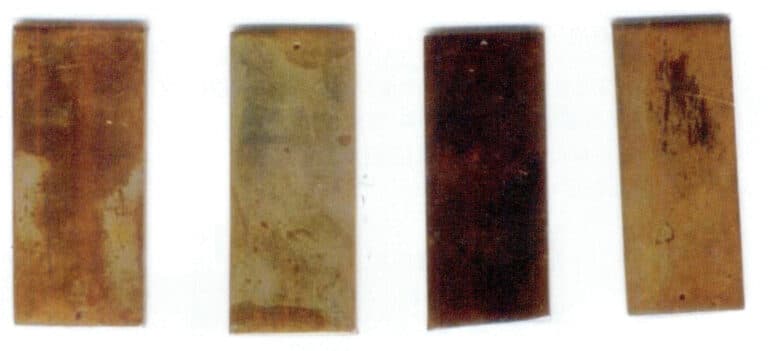
Figure 3-29 Surface discoloration of different silver alloys after immersion in sodium sulfide solution
3. Salt Spray Corrosion Test
For jewelry metal materials or jewelry that undergoes surface electroplating, anodizing, or other surface treatments, the material’s or coating’s corrosion resistance is an important quality indicator. The salt spray corrosion test method is one of the most widely used testing methods, utilizing a salt spray corrosion test chamber for testing, as shown in Figure 3-30. In the salt spray corrosion test chamber, a salt spray device can create artificially simulated salt spray environmental conditions to assess the corrosion resistance of products or metal materials in that environment. Since the concentration of chloride salts in the salt spray corrosion test chamber can be several times or even dozens of times that of a typical natural environment, the corrosion rate is significantly increased, which can greatly shorten the time to obtain results.
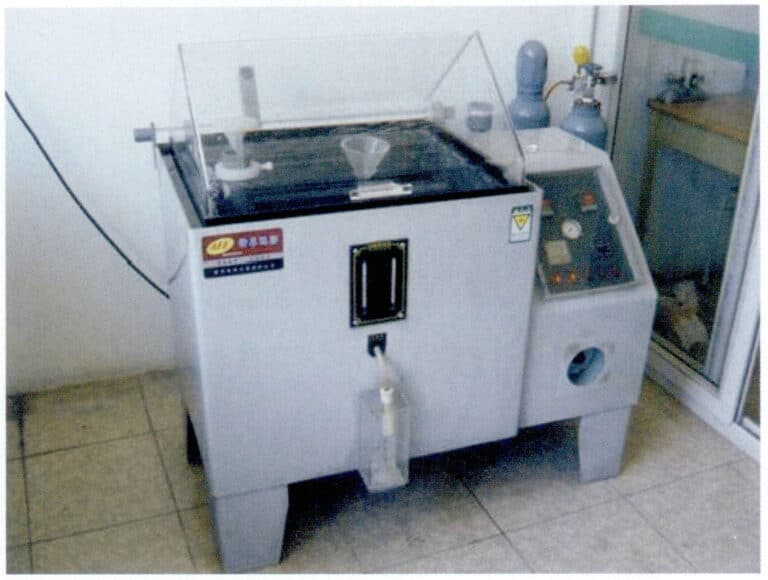
Figure 3-30 Salt Spray Corrosion Test Chamber
In jewelry plating layer testing is generally conducted according to the requirements of GB/T 10125-1997 standard, which uses a sodium chloride neutral solution with a concentration of 5% and a pH value of 6-7 to form a salt spray, with a test temperature of 35℃, humidity greater than 95%, and a salt spray deposition rate between 1-2ml/80cm2. Allow the salt spray to settle on the test specimen and observe its surface corrosion state after a certain period. The corrosion resistance of each sample is defined as the time it takes for the sample to show corrosion; the longer the time, the better the corrosion resistance performance.
Section VIII Common Mechanical Performance Testing Instruments and Equipment
Although not required to withstand various complex or harsh load conditions like in engineering fields, the metal materials used for jewelry must still meet the functional requirements for jewelry use well. Certain mechanical performance indicators should also be assessed. The indicators for evaluating the mechanical performance of metal materials include elasticity, strength, hardness, plasticity, toughness, fatigue performance, and fracture toughness performance, among others. There are various means and methods for testing these mechanical properties.
1. Strength
Jewelry needs to maintain its inherent shape during wear, making it resistant to deformation and even breakage; for jewelry set with gemstones, the metal setting must have sufficient strength to hold the gemstones in place; the welding of necklaces and bracelets must be secure to prevent detachment and breakage. To meet these requirements, the materials used for jewelry or the structure of jewelry products must possess adequate strength performance. Strength refers to the ability of metal materials to resist deformation and fracture under static load. Strength indicators are generally expressed as the load per unit area, denoted by σ, with units in MPa. Depending on different usage scenarios, the focus of strength assessment varies. The most commonly used strength indicators for jewelry pieces are yield strength and tensile strength. Yield strength refers to the stress at which a metal material begins to yield under external force or the minimum stress value at which plastic deformation starts, represented by σs. Tensile strength refers to the maximum stress value that a metal material can withstand before being pulled apart under tensile force, represented by σb.
The strength indicators of materials are tested using a universal testing machine (also known as an electronic tensile machine). This type of equipment generally employs a mechatronic design, mainly consisting of a force sensor, servo driver, microprocessor, computer, and printer. Depending on the size of the test load, it can be classified from a few kilograms to thousands of tons. For testing the strength of metal materials, conventional electronic tensile machines can be selected, as shown in Figure 3-31; for detecting the strength of jewelry structures, small tensile testing machines can be chosen; when both metal material strength and jewelry structure strength need to be considered, high-precision sensors can be configured on conventional electronic tensile machines.
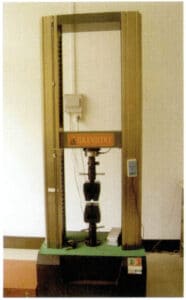
Figure 3-31 Commonly used electronic tensile machine
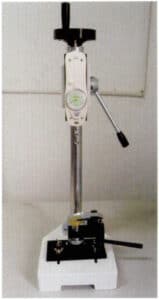
Figure 3-32 Pointer-type Pull Force Gauge
In set jewelry, the firmness of the setting is commonly used to measure the stability of gemstones. The so-called setting firmness refers to the force required to detach the main gemstone set in the jewelry mount (setting), denoted by p. Theoretically, the greater the setting firmness, the better; however, due to differences in materials and product structures, it is difficult to establish a unified standard for testing setting firmness. To date, an industry-standard QBT 4114-2010, “Setting Firmness of 24K Gold Set Jewelry,” has only been established for the issue of gemstones easily falling out of 24K gold settings. Setting firmness is generally tested using a pointer-type push-pull force gauge or a hand-operated testing machine, as shown in Figure 3-32. Uniform vertical pressure is applied to the bottom of the back of the gemstone in the sample, and when the gemstone detaches from the mount, the force recorded by the force gauge p is the setting firmness.
2. Hardness
Hardness is a performance indicator that measures the softness and hardness of materials, specifically the ability of a material’s surface to resist the penetration of hard objects. It is of significant importance for jewelry materials and products. Materials with high hardness can easily achieve high brightness during production and have good wear resistance, making them less prone to dents, scratches, and fading during use, thus maintaining brightness for a long time. Therefore, when selecting jewelry materials, it is necessary to test their hardness, and various strengthening methods should be employed during production to enhance their hardness.
The indicators for measuring material hardness include macrohardness and microhardness. The former includes commonly used indicators such as Rockwell and Brinell hardness, while the latter refers to Vickers hardness. Brinell hardness and Vickers hardness are The most commonly used indicators for precious metal jewelry materials. Brinell hardness is determined by applying a specific load with a hardened steel ball or hard alloy ball of a certain diameter onto the surface of the metal being tested, maintaining it for a specified time, and then unloading and measuring the diameter of the indentation left on the surface. The load divided by the surface area of the indentation gives the Brinell hardness value (HB) with units of N/mm2. It is the method with the largest indentation among all hardness tests. It can reflect the comprehensive performance of the material, unaffected by the microsegregation and uneven composition of the sample. Vickers hardness is suitable for microanalysis. It uses a load of up to 120 kg and a diamond square pyramid indenter with an apex angle of 136 degrees pressed into the material’s surface. The load value divided by the surface area of the indentation gives the Vickers hardness value (HV) with units of N/mm2. In Vickers hardness testing, the hardness value is independent of the size of the indenter and the load value, eliminating the need to change the indenter based on the material’s softness or hardness. The square indentation profile also has clear edges, making it easy to measure.
There is a certain conversion relationship between Brinell hardness and Vickers hardness within a certain range, which also corresponds to the strength properties of the material, as shown in Table 3-7. Therefore, hardness is not a purely physical quantity but a comprehensive performance indicator that reflects the material’s elasticity, plasticity, strength, and toughness.
Table 3-7 Correspondence between Brinell hardness, Vickers hardness, and tensile strength
| Tensile strength Rm(N/mm2) | Vickers hardness HV | Brinell hardness HB | Tensile strength Rm(N/mm2) | Vickers hardness HV | Brinell hardness HB |
|---|---|---|---|---|---|
| 250 | 80 | 76.0 | 865 | 270 | 257 |
| 285 | 90 | 85.2 | 900 | 280 | 266 |
| 320 | 100 | 95.0 | 930 | 290 | 276 |
| 350 | 110 | 105 | 965 | 300 | 285 |
| 380 | 120 | 114 | 1030 | 320 | 304 |
| 415 | 130 | 124 | 1060 | 330 | 314 |
| 450 | 140 | 133 | 1095 | 340 | 323 |
| 480 | 150 | 143 | 1125 | 350 | 333 |
| 510 | 160 | 152 | 1155 | 360 | 342 |
| 545 | 170 | 162 | 1190 | 370 | 352 |
| 575 | 180 | 171 | 1220 | 380 | 361 |
| 610 | 190 | 181 | 1255 | 390 | 371 |
| 640 | 200 | 190 | 1290 | 400 | 380 |
| 675 | 210 | 199 | 1320 | 410 | 390 |
| 705 | 220 | 209 | 1350 | 420 | 399 |
| 740 | 230 | 219 | 1385 | 430 | 409 |
| 770 | 240 | 228 | 1420 | 440 | 418 |
| 800 | 250 | 238 | 1455 | 450 | 428 |
| 835 | 260 | 247 | 1485 | 460 | 437 |
Brinell and Vickers hardness testers come in various models, and companies can choose according to their production needs. Currently, digital hardness testers are widely used, and they can automatically calculate and visually display the measurement values. Figures 3-33 and 3-34 are digital Brinell and Vickers hardness testers
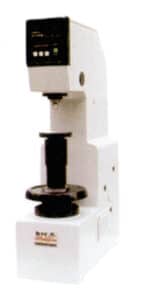
Figure 3-33 Digital Brinell Hardness Tester
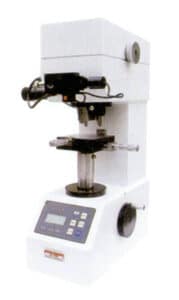
Figure 3-34 Digital Vickers Hardness Tester
3. Ductility
The plasticity of a material refers to its ability to undergo permanent deformation under external forces without losing its integrity. Plasticity is an important indicator during the deformation processing of materials, generally represented by the elongation rate δ or the reduction of area Ψ at fracture during a uniaxial tensile test, which characterizes the extent of allowable plastic deformation during plastic processing, also known as the plasticity index. The plasticity of a material can be obtained along with strength indicators using a universal testing machine.
The toughness of a material refers to its ability to absorb the work of plastic deformation and the work of fracture before breaking, characterizing the material’s resistance to crack propagation. It can be divided into impact toughness and fracture toughness. Toughness is a comprehensive indicator of strength and plasticity; the better the toughness, the lower the likelihood of brittle fracture. The magnitude of a material’s impact toughness is determined through impact testing. Figure 3-35 shows a commonly used pendulum impact testing machine, which strikes the sample once and measures the impact work value consumed per unit area of the sample, serving as the material’s impact toughness value.
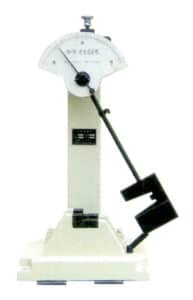
Figure 3-35 Pendulum Impact Testing Machine
4. Elasticity
For jewelry such as open bangles and open rings or jewelry accessories like bangle clips, bracelet (necklace) clasps, and ear hooks, a certain degree of elasticity is required to return to their original shape after being worn. The so-called elasticity refers to the ability of materials to deform under external forces within certain limits and to return to their original state after removing those forces. The evaluation of material elasticity includes indicators such as Young’s modulus, shear modulus, proportional limit, and elastic limit, among which the most commonly used is the elastic limit. This refers to the maximum stress that a material can withstand while maintaining elastic deformation without producing permanent deformation, represented by σe, with units in MPa (or N/mm2 ). The elastic limit can be tested using a universal testing machine.
Section IX Common Safety Testing Methods for Jewelry
Safety is an important aspect of testing for jewelry that comes into direct contact with human skin or even pierces different parts of the body, mainly focusing on metal allergies, metal toxicity, and bacterial contamination of jewelry. Professional testing institutions generally conduct these tests. The most common tests are metal allergy tests and metal toxicity tests.
1. Metal Allergy and Testing Methods
Among the commonly used metal materials for jewelry, nickel is the most prominent sensitizing metal element. The testing methods for evaluating nickel allergy in jewelry include colorimetric, patch, and nickel release tests.
1.1 Color Development Test Method
In an ammonia solution, nickel reacts with dibenzoyl oxime to form a soluble complex with characteristic colors ranging from pink to cherry red. Therefore, the color change of the test swab can indicate whether nickel is present in the material, whether a piece of jewelry meets nickel release requirements, whether the base material complies, or if it has been treated with electroplating or coating. However, the results of the dibenzoyl oxime test are influenced by a series of conditions; it is only suitable for preliminary judgments to exclude serious sources of nickel release, serving as a screening method. A complete nickel release test is necessary to determine whether the nickel release level of the jewelry meets the requirements.
1.2 Patch Test
The patch test has a history of over 100 years. It observes whether the skin is allergic to jewelry by directly contacting the jewelry material with the skin, which is classified as a provocation test. The basic method involves artificially simulating the environment that causes allergic contact dermatitis, placing a small amount of diluted allergen on certain areas of the skin for a specific time (generally 48 hours), and then removing the patch sample. Whether an allergic reaction has occurred is based on the changes in the skin in the patch area. The patch test is a simple and reliable method for checking contact allergens. Still, there is disagreement on whether its results have a necessary relationship with the occurrence of systemic immune responses.
1.3 Nickel Release Test
Method. EN1811:1998 is used for jewelry without a coating on the surface. EN12472:1998 is used for jewelry with a coating on the surface, attempting to simulate the wear and corrosion of coated jewelry over a normal usage period of two years. This standard was revised in 2005, resulting in EN12472:2005. Due to the still high nickel sensitization rate, the standard was tightened, and the nickel directive 2004/96/EC, nickel release testing standard EN1811:1998 + A1:2008, and the stricter nickel release testing standard EN1811:2011 were subsequently issued, eliminating the adjustment value for nickel release rate.
Taking the most commonly used EN1811:1998 as an example, the testing method is as follows: prepare fresh artificial sweat (artificial sweat is a deionized saline solution containing 0.5% sodium chloride, 0.1% lactic acid, and 0.1% urea, with a pH value of 6.5. Place the treated samples into covered glass containers and use a pipette to add some artificial sweat to the container, ensuring that the samples are fully immersed in the sweat. Place the container in a constant temperature water bath, maintaining a stable temperature of 30℃, and let it sit for 168 hours. After soaking, test the nickel content of the solution using an atomic absorption spectrometer. Prepare three samples for each sample number for testing, and conduct a blank test using the same method. Based on the flame atomic absorption spectrometry analysis results, calculate the nickel release rate of the samples according to formula below:

In the formula: d is the actual nickel release rate, (/ug/cm2/week); V is the volume of the test solution, (mL); C1 and C2 are the nickel contents in the test solution and the blank test solution respectively, and (ug/L); A is the surface area of the test sample (cm2)
[Case 3-10] Detecting the nickel release rate of 18K gold in different states and evaluating its nickel sensitization risk.
The 18KW is rolled into sheets 1mm thick, and several samples of 10x10mm are cut from the sheets. The samples are subjected to different surface treatments such as polishing, sandblasting, and pushing sand, and nickel release tests are conducted according to the above method, yielding the results shown in table below.
| Surface condition | Average value (ug/cm2/week) | Compliance with EN1811:1998+ A1:2008 | Compliance with EN1811:2011 | ||
|---|---|---|---|---|---|
| Surface condition | Average value (ug/cm2/week) | Jewelry for prolonged direct contact with skin | For wearing decorative accessories | Jewelry for prolonged direct contact with skin | For wearing decorative accessories |
| Polished state | 0.83 | Qualified | Qualified | No conclusion | Unqualified |
| Sandblasted state (140 mesh) | 3.49 | Qualified | Unqualified | Unqualified | Unqualified |
| Pushing Sand State (1200 #) | 1.80 | Qualified | Qualified | Unqualified | Unqualified |
The surface condition of visible materials significantly impacts their release rate; the nickel release rate on smooth surfaces is lower than that on rough surfaces. Products considered qualified for nickel release under the original standard may be deemed unqualified or inconclusive under the stricter new standard.
2. Testing for toxic metal elements in jewelry
The national standard GB28480-2012 stipulates that toxic metal elements in jewelry refer to chemical elements that can harm human health or the environment during use, mainly including nickel, arsenic, cadmium, chromium, lead, mercury, antimony, selenium, etc., and specifies clear regulations on the total content or leaching amount of these elements.
For the determination of nickel leaching, follow the method introduced earlier. To determine other toxic elements, preliminary testing of their total content can be conducted according to the GB/T 28020 method. Based on the preliminary test results, the total content of arsenic, cadmium, lead, and mercury, as well as the leaching amounts of arsenic, cadmium, chromium (hexavalent), lead, mercury, and selenium, should be tested according to the regulations of GB/T 28021. The total content of hexavalent chromium should be determined according to GB/T 28019 and others.
When determining the leaching amount of toxic metal elements, jewelry made of metal materials can be treated directly using conventional acid digestion methods. A closed high-temperature pressure vessel—acid digestion method should be used for jewelry made of other materials. The sample’s arsenic, cadmium, lead, and mercury dissolve in the acid digestion solution as soluble salts. After diluting the digestion solution, flame atomic absorption spectrometry or inductively coupled plasma spectrometry can be used for measurement.
Immerse the samples that need to test the leaching amounts of arsenic, cadmium, chromium, lead, mercury, antimony, and selenium in a hydrochloric acid solution of a certain concentration for 2 hours, simulating the conditions of the sample being in contact with gastric acid for a period after swallowing. The concentrations of arsenic, cadmium, chromium, lead, mercury, antimony, and selenium ions in the hydrochloric acid solution can be measured using flame atomic absorption spectrometry or inductively coupled plasma spectrometry.
Section X Common Small Tools for Quality Inspection in Jewelry Production
1. Oil-based pen
Generally divided into different colors such as blue, red, and black, as shown in Figure 3-36. Any parts of the shipment that need reprocessing are marked with an oil-based pen. For example, the parts that need to be processed are marked with a blue oil-based pen; grinding marks are indicated with a red oil-based pen; areas, where sand pushing is insufficient or exceeds the boundary, are marked with a black oil-based pen. This way, when workers receive the returned workpieces from QC, they can easily identify which parts need to be repaired and how to do the repairs.
Figure 3-36 Colorful oil-based pens
2. Double-headed drill chuck
One end is a round needle, and the other is a flat shovel, as shown in Figure 3-37. It is mainly used to check whether the embedding of stone particles is stable. If there are loose stones, a small flat shovel can scrape a little gold from the edge of the stone particles to press the stones firmly.
Figure 3-37 Double-headed clamp
3. Steel pressing
Jewelry pieces generally require a high-gloss surface. However, during the production process, due to factors such as bumps, scratches, and friction, fine scratches appear on the polished product surface, especially in high-grade, low-hardness jewelry alloys. For fine scratches, local polishing can be done using steel pressing (Figure 3-38), and there is no need to return it to the workers for re-polishing. However, when using steel pressing, the force and direction must be properly controlled; otherwise, it can have the opposite effect. For obvious scratches, sand holes, and other defects, or when the hardness of the metal material is very high, the effect of using steel pressing is not good.
Figure 3-38 Steel pressing used for jewelry polishing.


