Poznaj dokładne metody badania czystości biżuterii z metali szlachetnych
Przewodnik po testowaniu zawartości metali szlachetnych w biżuterii
Spis treści
Sekcja ⅠZasady badania czystości biżuterii z metali szlachetnych
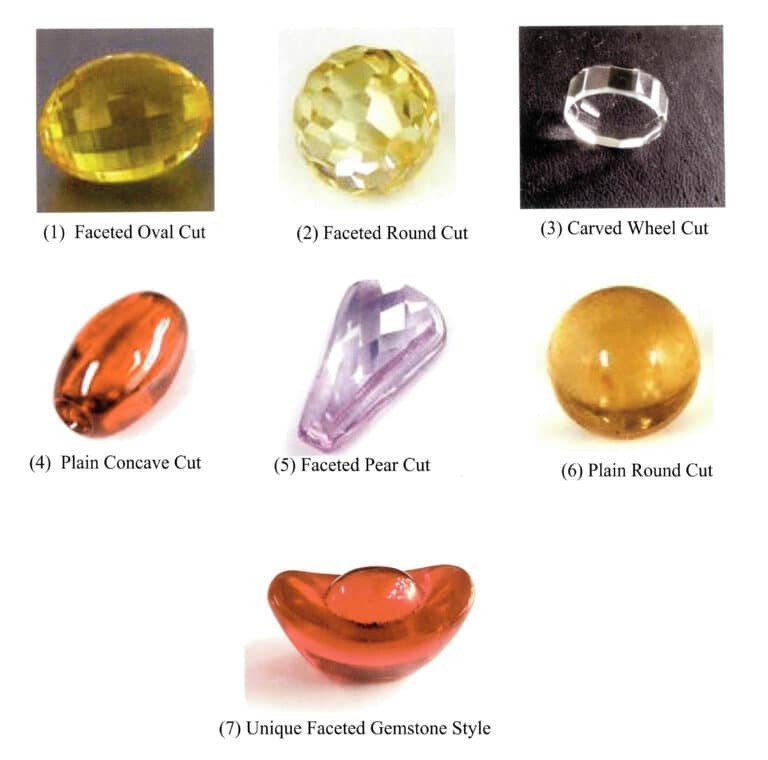
Testowanie czystości biżuterii z metali szlachetnych istnieje od czasów starożytnych. Nasi przodkowie polegali głównie na swoich zmysłach i dotychczasowych doświadczeniach, aby przeprowadzić testy w celu określenia czystości biżuterii z metali szlachetnych. Na przykład, obserwowali jej kolor oczami, ważyli ją rękami i testowali jej twardość poprzez gryzienie. Oczywiście stoi za tym również konkretne uzasadnienie naukowe. Jednak wraz z rozwojem nauki i technologii, ciągłe wynalezienie i aktualizowanie naukowych przyrządów testujących wprowadziło niektóre nowoczesne narzędzia naukowe do testowania czystości biżuterii z metali szlachetnych, zwłaszcza w testach komercyjnych.
Nowoczesna technologia testowania czystości biżuterii z metali szlachetnych opiera się na instrumentach naukowych charakteryzujących się dokładnością, krótkim czasem testowania, niskim kosztem i łatwością obsługi. Rozwija się ona w kierunku szybszych, prostszych i dokładniejszych metod. Wraz z ciągłym rozwojem nauki i technologii, techniki i metody testowania czystości biżuterii z metali szlachetnych będą stawały się coraz bardziej wyrafinowane.
Podczas testowania czystości biżuterii z metali szlachetnych należy przestrzegać następujących trzech zasad.
(1) Badania nieniszczące powinny być przeprowadzane w jak największym stopniu. Dlatego przy wyborze metod testowania należy wybierać metody, które nie uszkadzają wyglądu biżuterii z metali szlachetnych. Jeśli jest to naprawdę nieuniknione, należy uzyskać zgodę lub upoważnienie od klienta.
(2) Wykrywanie powinno utrzymywać pewien poziom dokładności. Innymi słowy, dokładność wykrywania powinna mieścić się w odpowiednim standardowym zakresie.
(3) Koszt wykrywania powinien być jak najniższy.
Konkretne cele wykrywania jakości biżuterii z metali szlachetnych obejmują głównie dwa aspekty: pierwszym jest identyfikacja autentyczności biżuterii z metali szlachetnych; drugim jest określenie jakości biżuterii z metali szlachetnych.
Sekcja II Powszechne proste metody wykrywania jakości biżuterii z metali szlachetnych
Od czasów starożytnych ludzie badali kompletny zestaw doświadczalnych metod identyfikacji jakości i autentyczności metali szlachetnych w oparciu o ich cechy. Prawidłowe wykorzystanie tych metod może skutecznie, szybko i jakościowo zidentyfikować autentyczność i jakość biżuterii z metali szlachetnych.
1. Metoda obserwacji kolorów
Starożytni ludzie uznawali, że istnieje pewna zależność między kolorem złota a jego zawartością. W folklorze istnieje powiedzenie: "Cztery siódemki to nie złoto". "Siedem zielonych" odnosi się do zawartości złota 70% i zawartości srebra 30%, gdzie złoto wydaje się zielonkawo-żółte; "Osiem żółtych" odnosi się do zawartości złota 80% i zawartości srebra 20%, gdzie złoto wydaje się złoto-żółte; "Dziewięć fioletowych" odnosi się do zawartości złota 90% i zawartości srebra 10%, gdzie złoto wydaje się fioletowo-żółte; "Dziesięć czerwonych" odnosi się do zawartości złota bliskiej 100% i wyjątkowo niskiej zawartości srebra, czyli czerwonego złota, drobnego złota lub czystego złota, gdzie złoto wydaje się czerwono-żółte. Ta tradycyjna metoda podsumowania doświadczenia jest skuteczna tylko w przypadku oceny czystego złota zawierającego srebro.
W przypadku czystego złota, szlachetnego złota, czerwonego złota, czystego czerwonego złota, złota próby 999 i 24-karatowego złota, nad złocistożółtym odcieniem występuje lekki czerwonawy odcień. Kolor określany jako "czerwone złoto" lub "szlachetne złoto" w folklorze jest kolorem czystego złota. W przypadku złota 22K, 18K, 14K, 10K, 9K, 8K, kolor złotej biżuterii odzwierciedla rodzaje i proporcje zanieczyszczeń w złocie. Ogólnie rzecz biorąc, kolor serii czystego złota zawierającego srebro ma tendencję do bycia żółtym, podczas gdy kolor serii mieszanego złota zawierającego miedź ma tendencję do bycia czerwonym.
Ocena jakości złota na podstawie wyświetlanego koloru może być jedynie opisem jakościowym. Wraz z rozwojem nowoczesnej nauki i technologii, złoto o różnej jakości może mieć ten sam kolor, jak już wcześniej wspomnieliśmy. Stosowanie tej metody do określania jakości naturalnego złota ma pewne uzasadnienie.
W tradycyjnej biżuterii rzemieślniczej sztuczna biżuteria srebrna często wykorzystuje aluminium lub stopy aluminium, białą miedź, cynę lub stopy cyny, które zwykle mają matowy szary kolor i słaby połysk; biżuteria o niskiej zawartości srebra ma lekko żółty lub szary kolor i słabe wyrafinowanie; biżuteria o wysokiej zawartości srebra jest jasna, czysto biała i ma lepszy połysk. Ogólnie rzecz biorąc, gdy biżuteria jest stopem srebra i miedzi, 85 srebra wydaje się lekko czerwonawe, 75 srebra wydaje się czerwono-żółte, 60 srebra wydaje się czerwone, a 50 srebra wydaje się czarne; gdy biżuteria jest stopem srebra i białej miedzi, 80 srebra wydaje się szaro-białe, a 50 srebra wydaje się czarno-szare; gdy biżuteria jest stopem srebra i mosiądzu, im niższa zawartość srebra, tym bardziej żółty kolor biżuterii. Ogólnie rzecz biorąc, czysto biała i precyzyjnie wykonana biżuteria ma jakość ponad 90%. Dla porównania, biała biżuteria z szaro-czerwonym i szorstkim wykonaniem ma jakość około 80%, a szaro-czarna lub jasnożółto-czerwona biżuteria ma zwykle jakość poniżej 60%. Należy zauważyć, że nowoczesna imitacja srebra lub biżuteria o niskiej zawartości srebra, gdy powierzchnia jest pokryta srebrem lub rodem, może mieć kolory, precyzję i połysk powierzchni nie do odróżnienia od prawdziwej srebrnej biżuterii, co uniemożliwia wizualną ocenę jakości biżuterii.
Jakość platyny i skład pierwiastków stopowych różnią się, co skutkuje różnymi wyświetlanymi kolorami: Platyna wyższej jakości ma niebieskawo-biały z lekko szarym kolorem. Platyna zawierająca pewną ilość Cu lub Au jest niebieskawo-biała z lekkim żółtym zabarwieniem. Platyna z wyższą zawartością Ag wygląda na srebrno-białą. Biżuteria palladowa ma zazwyczaj stalowo-biały kolor z dobrym metalicznym połyskiem. Imitacje platyny lub palladu są często wykonane z białej miedzi, stopów niklu, stopów sodu itp., które są podatne na utlenianie i matowienie.
2. Metoda testowania kamienia dotykowego
Metoda kamienia dotykowego jest najstarszym narzędziem i metodą identyfikacji autentyczności i jakości złota i srebra, z zapisami jej stosowania w starożytnych cywilizacjach na całym świecie. Polega ona na zarysowaniu badanej biżuterii i złotego wzorca (zestawu złotych płytek o określonej jakości, zwanych wzorcem) na kamieniu dotykowym. Porównując kolor zadrapań pozostawionych na kamieniu dotykowym, można określić autentyczność i jakość biżuterii. Ta metoda testowania od dawna uważana jest za stosunkowo dokładną, niezawodną i szybką metodę wykrywania. Nawet dziś wiele sklepów zajmujących się recyklingiem złota i srebra nadal często stosuje tę metodę do szybkiej identyfikacji materiałów, co pozwala wykryć zarówno jakość złotej biżuterii, jak i jakość biżuterii srebrnej.
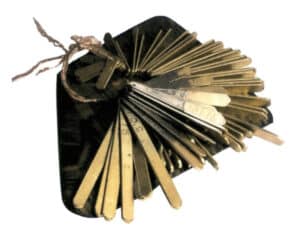
Tradycyjne kamienie dotykowe to głównie czarne lub szare kamienie, zwykle wykonane z czarnego krzemienia lub łupków krzemionkowych, o twardości Mohsa około 6,5 i delikatnej teksturze. Ciemne krzemionkowe kamyki skalne w pobliżu starożytnego złota i miedzi w Xinjiang w Chinach, ciemne krzemionkowe skały znane jako "pustynny lakier" na pustyni Gobi i czarne kamienie z kwiatów deszczu z Nanjing mogą być przetwarzane na doskonałe kamienie dotykowe po szlifowaniu. Złota płytka testowa to smukła mała płytka wykonana ze złota o różnej standardowej czystości, z wygrawerowaną standardową czystością złotej płytki na jednym końcu, która ma wywiercony mały otwór do nawlekania w grupy, zwykle składające się z wielu elementów, jak pokazano na rysunku 6-1. Im drobniejsza klasyfikacja złotej płytki testowej, tym szerszy zakres kolorów i dokładniejsze wyniki analizy.
Podstawową metodą badania czystości złotej biżuterii jest metoda kolorymetryczna. Metoda ta jest następująca:
(1) Przygotowanie kamienia dotykowego.
Umyć powierzchnię roboczą kamienia testowego wodą, spłukać i wysuszyć. Na powierzchni kamienia pokrytej olejem rycynowym, aby utworzyć kanał olejowy, długi do końców kamienia testowego, szerokość 20 mm jest odpowiednia, po naoliwieniu czystą jedwabną szmatką, aby zetrzeć pływający olej, tak aby kanał olejowy utrzymywał bardzo cienką warstwę. Gdy warstwa oleju jest zbyt gruba, łatwo jest zrolować olej i czerń, ale jeśli jest zbyt sucha, nie jest łatwo ją pokolorować. Krawędź kanału olejowego powinna być prosta, równa, równoległa do krawędzi kamienia testowego i bez części olejowej tworzącej wyraźne rozróżnienie, aby utrzymać szlifowanie tej samej długości złotego kanału. Zwróć uwagę na palce. Nie dotykaj powierzchni kamienia; unikaj powierzchni poplamionej kurzem i wilgocią, szczególnie w jamie ustnej i potu w dłoniach. W przeciwnym razie zabarwienie wymaga pracy.
(2) Metoda szlifowania.
Podczas korzystania z kamienia dotykowego do szlifowania, zazwyczaj trzymaj kamień lewą ręką, a złoto prawą ręką, z kciukiem na górze i pozostałymi palcami poniżej. Naoliwiona strona powinna znajdować się na górze, a kamień dotykowy powinien być mocno trzymany w dłoni i ustabilizowany na stole bez ruchu. Podczas szlifowania testowany przedmiot lub płytka testowa powinny być mocno dociśnięte do powierzchni kamienia, a prawa ręka trzymająca złoto powinna wykorzystywać siłę nadgarstka. Ścieżka szlifowania ma zazwyczaj 20-30 mm długości i 3-5 mm szerokości. Ścieżka kawałka złota i ścieżka płytki testowej powinny być spójne pod względem długości i szerokości, a ścieżka płytki testowej może być szlifowana po obu stronach ścieżki kawałka złota w celu porównania kolorów. Jeśli kolor ścieżki złotego elementu jest niezgodny ze ścieżką płytki testowej, wybierz inną płytkę testową do szlifowania i obserwuj kolor, aż obie ścieżki będą się zgadzać.
(3) Identyfikacja
Gdy złoto zostanie zadrapane na kamieniu dotykowym, pozostawia kolorowy ślad. Przez długi okres praktyki ludzie podsumowali zestaw doświadczeń służących do identyfikacji autentyczności i jakości złota za pomocą kamienia dotykowego, znanego jako "spójrz na kolor płasko, spójrz na światło pod kątem, słuchaj uważnie dźwięku". Czyste złoto zawierające srebro jest miękkie, a ścieżka złota wydaje się niebieskawa bez pływającego koloru, koncentrując się głównie na "patrzeniu na kolor płasko", a po drugie na "patrzeniu na pływający kolor pod kątem". W przypadku mieszanego złota zawierającego srebro i miedź, podczas szlifowania pojawia się dźwięk i pływające światło, skupiając się głównie na "patrzeniu na pływający kolor pod kątem", a po drugie na "patrzeniu na płaski kolor". Użycie kwasu do erozji ścieżki złota może zwiększyć różnice w kolorze i podkreślić cechy wyróżniające. Użyty kwas powinien preferencyjnie reagować z metalami nieszlachetnymi i srebrem w materiałach z metali szlachetnych. W zależności od jakości stopu, użyte kwasy mogą obejmować kwas azotowy, mieszaninę kwasu azotowego i soli lub mieszaninę kwasu azotowego i kwasu solnego itp.
Metoda touchstone do testowania jakości złotej biżuterii jest określana przez obserwację wizualną i porównanie, co wymaga bogatego doświadczenia praktycznego i jest pod wpływem wielu czynników ludzkich, co skutkuje ograniczoną dokładnością. Dodatkowo, wraz ze wzrostem rodzajów złotej biżuterii i coraz bardziej złożonym jej składem, przy ograniczonej liczbie kart złota, rozróżnienie między elementami pozłacanymi i powlekanymi złotem staje się trudne. Wraz z ciągłym rozwojem nieniszczącej technologii testowania złota, metoda kamienia dotykowego została stopniowo zastąpiona przez inne, wygodniejsze, prostsze i bardziej precyzyjne metody.
3. Metoda ważenia
Złoto ma wysoką gęstość, przy czym czyste złoto ma gęstość 19,32 g/cm3 gęstość. Po zważeniu ręką wydaje się ciężki i ma odczuwalną wagę. Ponieważ gęstość złota jest znacznie większa niż metali takich jak ołów, srebro, miedź, cyna, żelazo i cynk, niezależnie od tego, czy jest to mosiądz (o gęstości 8,9 g/cm3), stopy na bazie miedzi lub materiały imitujące złoto, takie jak rzadkie złoto, sub-złoto, imitacja złota itp. lub pozłacane przedmioty, pozłacane przedmioty, takie jak złoto i biżuteria wypełniona złotem, nie mają wrażenia ciężkości czystego złota po zważeniu ręcznym. Metoda ważenia jest najskuteczniejsza w przypadku rozróżniania 24-karatowego złota. Mimo to może być bardziej skuteczna w identyfikacji pozłacanych lub wypełnionych złotem produktów wykonanych ze stopu wolframu, który ma gęstość podobną do złota, ponieważ trudno jest wyczuć różnicę między nimi ręcznie.
Gęstość platyny wynosi 21,45 g/cm3a masa tej samej objętości platyny jest ponad dwukrotnie większa niż srebra (o gęstości 10,49 g/cm).3). Jest również gęstsza niż złoto, co sprawia, że jest cięższa, gdy jest ważona ręcznie. Dlatego też, przy użyciu metody ważenia w celu rozróżnienia biżuterii platynowej, złotej i srebrnej, istnieje powiedzenie: "Ciężkie to platyna lub złoto, lekkie to srebro lub mosiądz".
Ponieważ istnieje również znaczna różnica w gęstości między srebrem a aluminium i stalą nierdzewną, metoda ważenia może być również wykorzystana do ich rozróżnienia, mówiąc: "Aluminium jest lekkie, srebro jest ciężkie, produkty z miedzi i stali nie są ani lekkie, ani ciężkie".
4. Metoda ciągliwości
Łatwość wyginania biżuterii może również pośrednio wskazywać na czystość złotej biżuterii i rodzaj materiału z metalu szlachetnego. Czyste złoto charakteryzuje się doskonałą elastycznością, co jest kompleksową manifestacją wysokiej wytrzymałości i niskiej twardości złota. Srebro jest następne, platyna jest twardsza niż srebro, a miedź ma najwyższą twardość. Stopy złota i srebra są nieco twardsze, a stopy złota i miedzi są jeszcze twardsze; im niższa zawartość złota w stopie, tym wyższa twardość. Na przykład, biżuteria z czystego złota jest bardzo miękka, gdy jest delikatnie zginana przy otworze lub zapięciu, podczas gdy imitacje złota nie mają takiego odczucia. Dlatego czyste złoto jest łatwe do zginania i łamania, podczas gdy biżuteria ze złota o niższej czystości nie jest łatwa do zginania i jest podatna na pękanie.
Korzystając z tej metody do testowania złotej i srebrnej biżuterii, należy zwrócić szczególną uwagę na wpływ szerokości i grubości biżuterii na jej elastyczność. Ogólnie rzecz biorąc, szersza i grubsza biżuteria jest twardsza podczas zginania; odwrotnie, węższa i cieńsza biżuteria jest bardziej miękka.
5. Metoda badania twardości
Twardość biżuterii z metali szlachetnych jest ściśle związana z zawartością złota; im wyższa czystość, tym niższa twardość. Czyste złoto ma bardzo niską twardość; powszechną metodą jest gryzienie go zębami. Ponieważ twardość zębów jest większa niż złota, na złocie mogą pozostać ślady ugryzień, wskazujące, że jest to złoto o wysokiej czystości. Z kolei materiały imitujące złoto mają wyższą twardość, co utrudnia pozostawienie śladów ugryzień. Podczas testowania twarda miedziana igła jest zwykle używana do delikatnego zarysowania tylnej lub niepozornej części biżuterii; im głębsza rysa, tym wyższa zawartość złota i odwrotnie, jeśli rysa nie jest oczywista lub płytka. Ważne jest, aby pamiętać, że w testach komercyjnych stosowanie tej metody do testowania czystości biżuterii z metali szlachetnych jest uważane za badanie niszczące i powinno być wykonywane za zgodą lub upoważnieniem klienta.
Czyste srebro ma również niską twardość i można je zarysować paznokciem. Jeśli biżuteria jest miękka i nie jest twarda, może zawierać cynę lub ołów; jeśli jest twarda i nie jest twarda, może być wykonana z miedzi (srebro niklowe), żelaza lub innych stopów.
6. Metoda testu ogniowego
Jak mówi przysłowie: "Prawdziwe złoto nie boi się ognia" i "Intensywny ogień ujawnia prawdziwe złoto". Złoto ma wysoką temperaturę topnienia (1063 ℃) i może pozostać nietopliwe, nieutlenione i niezmienione w kolorze w wysokich temperaturach (poniżej temperatury topnienia). Nawet jeśli temperatura przekroczy temperaturę topnienia i złoto zacznie się topić, nadal zachowa swój kolor. W przeciwieństwie do tego, złoto o niskiej próbie i imitacje złota zmieniają kolor, a nawet stają się czarne, gdy są spalane na czerwono i schładzane.
Temperatura topnienia platyny (1773 ℃) jest wyższa niż złota. Po spaleniu i schłodzeniu jej kolor pozostaje niezmieniony, podczas gdy srebro zmienia kolor na mlecznobiały, czerwonawy lub czarno-czerwony po spaleniu i schłodzeniu, w zależności od zawartości srebra.
7. Metoda słuchania dźwięków i tonów
Ze względu na niską twardość złota, srebra i platyny, gdy biżuteria z litego złota lub wysokokaratowego złota jest wyrzucana w powietrze, jej dźwięk po wylądowaniu jest tępy, bez hałasu i odbicia. Gdy biżuteria spadnie na twardą cementową podłogę, biżuteria z wysokokaratowego złota lub platyny będzie wydawać tępy dźwięk o niewielkiej elastyczności; biżuteria o niższej próbie, miedź lub produkty ze stali nierdzewnej będą emitować ostry i głośny dźwięk z dużym odbiciem. Tradycyjne czyste złoto ma dźwięk, ale nie ma tonu i niewielkie odbicie, podczas gdy mieszane złoto ma dźwięk, ton i odbicie, z większym odbiciem i ostrzejszymi, dłuższymi tonami wskazującymi na niższą czystość. Jednak wraz z postępem w technologii produkcji złotej biżuterii, na obecnym rynku pojawiło się wiele hartowanych produktów z litego złota o wysokiej wytrzymałości, spełniających standardy złota próby 999 i charakteryzujących się dobrą elastycznością.
Gęstość platyny jest wyższa niż złota, a charakterystyka dźwiękowa platyny po wyrzuceniu w powietrze i upadku na ziemię jest podobna do złota, co można wykorzystać do rozróżnienia imitacji platyny, biżuterii platynowej i powlekanej platyną.
Podobnie, srebro próby 925 i biżuteria ze srebra o wysokiej czystości mają wysoką gęstość i miękką teksturę, co skutkuje niską wysokością odbicia po upuszczeniu na powierzchnię. Z kolei biżuteria z fałszywego srebra lub srebra o niskiej czystości ma stosunkowo wyższą wysokość odbicia ze względu na niską gęstość i twardość.
8. Metoda znakowania
Złota biżuteria musi być stemplowana zgodnie z międzynarodowymi standardami, aby wskazać jej czystość. W naszym kraju 24-karatowe złoto jest oznaczone jako "czyste", "szlachetne złoto", "czerwone złoto" lub "24K", a 18-karatowe złoto jest oznaczone między innymi jako "18K" lub "750".
W naszym kraju czystość srebra jest reprezentowana przez tysięczną, procentową lub ułamkową część, po której następuje znak "s" (srebro), taki jak "800s", "80s" i "80% S", wszystkie wskazujące na czystość srebra 80%; na arenie międzynarodowej jest to zwykle reprezentowane przez tysięczną, po której następuje "S" lub "Silver", takie jak "800 S" i "800 Silver", oba wskazujące na czystość srebra 80%. Istnieje również posrebrzana pieczęć materiałowa, powszechnie reprezentowana na arenie międzynarodowej przez "SF" (początkowe litery wypełnienia srebrem).
Na arenie międzynarodowej czystość i jakość platyny są oznaczane liczbą tysięczną, po której następuje "Pt", "Plat" lub "Platinum", np. 950Pt oznacza czystość platyny 95%; w Stanach Zjednoczonych jest ona oznaczona tylko "Pt" lub "Plat", co gwarantuje, że czystość platyny wynosi powyżej 95%.
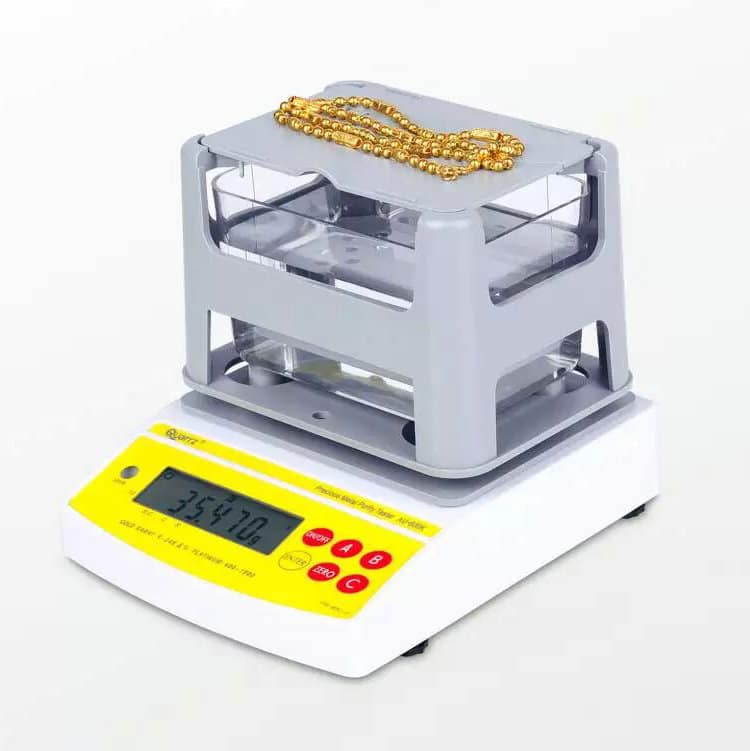
Sekcja III Metoda hydrostatyczna (metoda gęstości)
1. Zasada wykrywania
Gęstość czystego złota wynosi 19,32 g/cm3. Jeśli gęstość określonej ozdoby z metalu szlachetnego jest niższa niż ta wartość, można potwierdzić, że w jej skład wchodzą inne metale. Wielkość gęstości jest ściśle związana z czystością złota. Czystość złota można wywnioskować na podstawie gęstości, co jest podstawową zasadą stosowania metody gęstości do testowania czystości biżuterii z metali szlachetnych.
Objętość biżuterii jest równa sumie objętości czystego złota w biżuterii i objętości metali zanieczyszczających, która wynosi:
V = Vczysty + Vzanieczyszczenia (6-1)
W formule:
V - objętość akcesorium (ml);
Vczysty-Objętość czystego złota w biżuterii wynosi (mL)
Vzanieczyszczenia -Objętość zanieczyszczeń w biżuterii wynosi (mL)
Używając wagi analitycznej 1/10000 do dokładnego ważenia, masa złotej biżuterii wynosi m; następnie, używając cienkiej nici do zabezpieczenia biżuterii, jej masa w wodzie jest dokładnie mierzona jako m' (w razie potrzeby należy odjąć masę nici). Zgodnie z zasadą Archimedesa, siła wyporu działająca na obiekt w wodzie jest równa masie wypartej przez niego wody, tzn:
m - m' = V x ρ woda (6-2)
Zwykła gęstość wody wynosi 1 g/cm3 w wyniku czego: m - m' = V, Podstawiając równanie (6-1) otrzymujemy:
m - m' = Vczysty + V zanieczyszczenia
Z zależności między objętością i masą obiektu V = m/ρ wynika, że:

Upraszczając powyższe równanie i podstawiając gęstość czystego złota ρ pure =19,32 g/cm3 aby przekonwertować go na ułamek masowy, otrzymujemy:
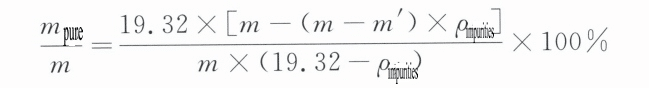
W formule:
m - jakość biżuterii (g);
m' - jakość biżuterii w wodzie (g);
m czysty - jakość czystego złota w biżuterii (g);
ρ zanieczyszczenia - gęstość zanieczyszczeń w biżuterii (g/cm)3)
2. Metoda przyjmowania wartości ρ zanieczyszczeń
Powyższy wzór służy do wykrywania zawartości złota w złotej biżuterii, a rzeczywiste ważenie wagi analitycznej pozwala ją uzyskać. Wartość zanieczyszczeń pozostaje do ustalenia. Zgodnie z doświadczeniem złotej biżuterii w głównych zanieczyszczeniach Ag i Cu, gęstość zanieczyszczeń jest określana przez względną zawartość zanieczyszczeń w Ag i Cu. Wśród nich gęstość Ag wynosi 10,49 g/cm3a gęstość Cu wynosi 8,90 g/cm3, więc wartość zanieczyszczeń waha się między 8,90 ~ 10,49/cm3. Wartości zanieczyszczeń są następujące:
Dla stopów złoto-srebrnych (czyste złoto): ρ zanieczyszczenia = ρ srebro = 10,49 g/cm3
Dla stopów serii złoto-miedź (złoto mieszane): ρ zanieczyszczenia = ρ miedź = 8,90 g/cm3
Dla stopów serii złoto - srebro - miedź (złoto mieszane): ρ zanieczyszczenia =1/(x/ρ srebro + y/ρ miedź), x+y = 1
Jeśli x = y =0,5 , to ρ zanieczyszczenia =9,63 g/cm3
If x:y = 1 : 2 , then x = 0.3333, y = 0.6666, ρ impurities = 9.375
If x:y = 2 : 1 , then x = 0.6666, y = 0.3333, ρ zanieczyszczenia = 9.901
The above analysis shows that the density of gold alloy and the density of different types and proportions of impurity metals are the main factors for accurately calculating the quality of gold jewelry. Only when the types and proportions of impurity metals in the sample being tested are known in advance can the quality of the sample be calculated using the density method, which is also a necessary condition for density testing.
It should be noted that the hydrostatic method can more accurately determine the gold content of pure gold jewelry. Alternatively, when the elemental ratios of the alloy components are known, the gold content in the jewelry can be calculated based on the detected density value of the jewelry. However, when the component ratios of the alloy are unknown, it is usually impossible to calculate the gold content in the jewelry based on the detected density value. Therefore, when the alloy components are uncertain, there is no one-to-one correspondence between the gold content of the jewelry and the density value.
3. Characteristics of Density Method Detection
The density method tests the density of jewelry using Archimedes’ principle, calculating the quality content based on the density of gold-silver-copper alloys as a function of gold content. This method has advantages such as convenience, speed, non-destructive sampling, minimal equipment, and ease of operation. It effectively distinguishes the authenticity of gold jewelry, such as determining whether it is gold or gold-plated and measuring the gold content of pure gold jewelry. Inspection accuracy is relatively high for seamless stamped jewelry, such as rings and whip chains. However, it cannot test hollow jewelry. It cannot distinguish high-density impurities, such as tungsten, which has a density of 19.35 g/cm3, very close to that of pure gold, making it difficult to measure using this method. The error in testing the quality of K gold jewelry is significant, especially when there are sand holes and welding holes inside the jewelry, gaps on the surface where the working liquid cannot penetrate, or impurities other than gold and silver, which can lead to errors in the detection results.
4. Detection Methods
4.1 Double Pan Balance Method
4.1.1 Testing Instruments
A balance with a sensitivity of 0.1mg, immersion liquid, a small table, and fine copper wire (hair can be used as a substitute).
(1) Balance. You can choose a mechanical or electronic balance with a sensitivity of 0.1mg.
(2) Immersion liquid. You can choose anhydrous ethanol, carbon tetrachloride, xylene, water, or ethanol mixed with water contained in a 50mL glass beaker.
(3) Small table. A small table made of a metal plate, according to the balance model, can be placed above the weighing pan without affecting the up-and-down movement of the pan.
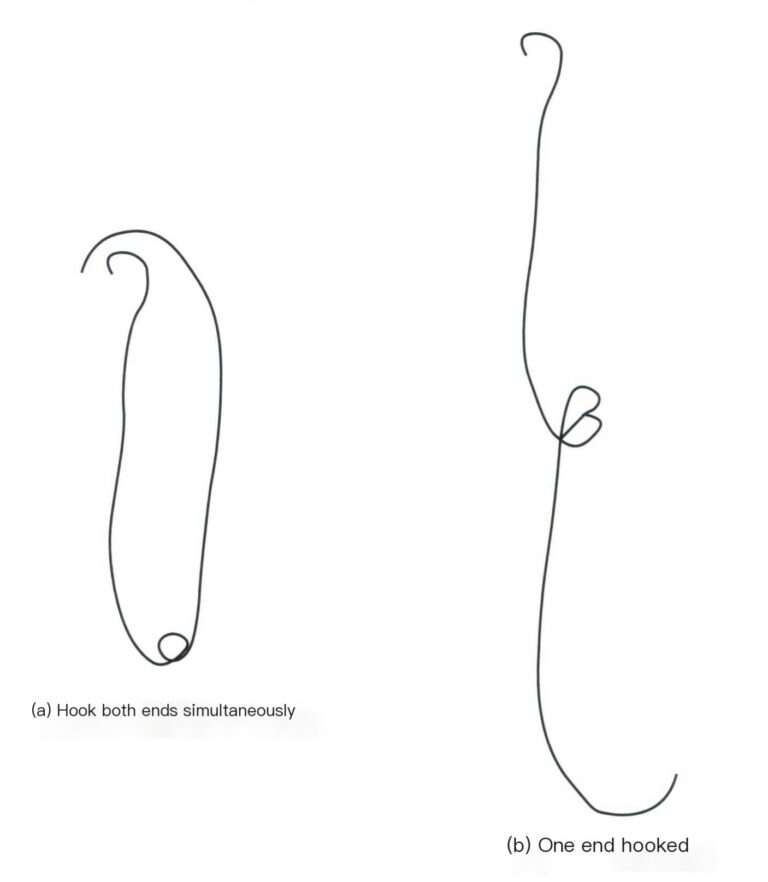
(4) Fine copper wire. Cut several pieces of fine copper wire of equal length (Φ=0.2 mm), weigh them with the balance, and select two segments from each group with equal total mass, dividing them into two groups. Roll one end of the two small segments of one group into small hooks and twist the other ends together so both small hooks can hang simultaneously on the weighing pan [Figure 6-2(a)], one end can be hooked onto the sample holder, while the other end is immersed in the solution [Figure 6-2(b)]; another group can be placed directly on the weight pan. If using hair, all details and processing steps of the fine copper wire can be omitted, and a small loop can be made with the hair tied to the gold jewelry, hanging it on the middle hook of the sample holder.
4.1.2 Operating Steps
(1) Check the balance of zero points. Remove the fine copper wire, determine the balance zero point, adjust the screw so that the sensitivity is no greater than 0.0001g, then hang the fine copper wire on both sides and adjust the balance zero point so that the pointer aligns with the “0” position; if using hair, this step of adjusting the balance zero point after hanging the copper wire can be omitted.
(2) Determine the temperature correction curve. The density of the immersion solution varies at different temperatures. Table 6-1 lists ethanol, xylene, and carbon tetrachloride densities at different temperatures. In practice, the purity of the organic solution, the introduction of impurities later, and the temperature difference between the thermometer and the temperature of the immersion solution beaker can all cause the measured results to deviate from the data in Table 6-1, with some even differing significantly.
Table 6-1 Densities of Ethanol, Xylene, and Carbon Tetrachloride Immersion Solutions at Different Temperatures
| Infusion | |||||
|---|---|---|---|---|---|
| Ethanol | Ethanol | Xylene | Xylene | Carbon tetrachloride | Carbon tetrachloride |
| Gęstość /(g/cm3) | Temperatura /℃ | Density / (g/cm3) | Temperatura /℃ | Gęstość /(g/cm3) | Temperatura /℃ |
| 0.837 | 7 | 0.839 | 6 | 1.630 | 3 |
| 0.830 | 16 | 0.829 | 16 | 1.610 | 13 |
| 0.829 | 18 | 0.824 | 22 | 1.599 | 18 |
| 0.827 | 19 | 0.819 | 27 | 1.589 | 23 |
| 0.821 | 21 | 0.814 | 32 | 1.579 | 28 |
| 0.817 | 26 | 0.809 | 37 | 1.569 | 33 |
| 0.810 | 32 | 0.804 | 42 | 1.559 | 38 |
(3) Clean the precious metal jewelry thoroughly and wipe it with anhydrous ethanol or acetone until dry.
(4) Hang the gold jewelry on the middle hook of the weighing pan with fine copper wire or hair, and weigh the mass of the precious metal jewelry m.
(5) Immerse the precious metal jewelry in the immersion liquid beaker and weigh the mass of the gold jewelry in the immersion liquid m.
(6) Calculate the density of the precious metal jewelry ρ złoto =m/(m-m’) x relative to the density of the immersion liquid.
(7) Convert to the fineness of the precious metal (gold or silver) based on the density and assumed end-member metals.
4.1.3 Notes
(1) Precious metal jewelry must be clean and dry; otherwise, the error will be significant.
(2) The working curve must be calibrated regularly; it cannot be a one-time fix.
(3) When precious metal jewelry is immersed in the solution, do not weigh it immediately; shake it for a while and visually check for any bubbles. If there are any visible small bubbles, they must be removed.
(4) Ethanol, xylene, and carbon tetrachloride are all volatile; measurements must be quick and stable, and be careful not to spill them on the balance. After the measurement, cover it with a special lid or pour it into a dedicated bottle; do not pour it back into the original container.
(5) If there is a situation where the density exceeds that of gold, calibration must be performed.
(6) The name, quality, shape, surface structure, and color of precious metal jewelry should be recorded, especially the color and surface. The structure is very important, as it can prevent discrepancies in the quality of tungsten-containing jewelry. Keeping the original data allows for the analysis of detection errors, which is beneficial for quality management.
4.2 Single-pan electronic balance method
4.2.1 Instrument
An electronic single-pan balance with a sensitivity of 0.0001g, immersion liquid, and suspension rack.
(1) Electronic balance. Single pan, sensitivity of 0.0001g or more sensitive, digital display.
(2) Immersion liquid. Similar to the double pan method, since there is no balance hanger, a slightly larger beaker can be used for holding.
(3) Suspension frame. It can be made larger, fixed outside the weighing pan without affecting the up and down movement of the weighing pan, with a height that is 1.5 ~ 2 times that of the immersion liquid beaker; it is also possible to weigh in the air by placing it on the weighing pan, holding it by hand in the immersion liquid, or making a hook on the balance cover to hang the sample on the balance cover.
4.2.2 Operating steps
(1) Check the balance zero point; refer to the electronic balance user manual for inspection.
(2) Determine the temperature correction curve using the double pan method.
(3) Wash and dry precious metal jewelry using the double pan method.
(4) Place the immersion liquid beaker on the weighing pan, install the suspension frame, pour in the immersion liquid, and adjust the balance to zero.
(5) Place the precious metal jewelry on the weighing pan, read the mass of the precious metal jewelry m, and record it.
(6) Hang the precious metal jewelry on the suspension frame with hair, immerse it in the immersion liquid, directly read the mass difference of the precious metal jewelry in air and the immersion liquid (m-m’), and record it.
(7) Calculate the density of precious metal jewelry using the double pan method.
(8) Convert the fineness of precious metal jewelry using the double pan method.
4.2.3 Notes
(1) The single pan method does not have a table pad, and the volatility of the immersion liquid significantly affects accuracy. Therefore, the time between zeroing and measuring the mass must be short, and measurements should be quick and stable, especially in summer, when the time interval between two measurements should be minimized.
(2) The sample pan must be centered, and the immersion liquid beaker should be placed in the center; otherwise, it will affect the measurement results.
(3) The sensitivity of the electronic balance must be checked, and the digital display system should also be verified with known standards.
(4) Be careful when pouring the liquid, and do not spill it on the surface of the electronic balance.
Section IV X-ray Fluorescence Analysis Method (XRF Method)
X-ray fluorescence spectroscopy (XRF) is an effective analytical method widely used in metallurgy, mining, petroleum, environmental protection, medicine, geology, archaeology, criminal investigation, grain and oil, finance, and other sectors. The X-ray fluorescence spectroscopy method for precious metals is one of the testing methods recommended by international financial organizations.
1. Basic Principles of X-ray Fluorescence Analysis
The electron probe determines the wavelength (or energy) and intensity of the characteristic X-ray spectral lines emitted after the sample is excited. X-ray fluorescence analysis is similar to this, but unlike the electron probe, the incident light is X-rays. The irradiated sample absorbs the primary X-rays and is excited to emit secondary X-rays. Various secondary X-rays are referred to as X-ray fluorescence, and by measuring the wavelength (or energy) and intensity of these characteristic spectral lines, the content of elements can be determined.
2. Structure of X-ray fluorescence spectrometer
In 1948, Friedman (H. Friedman) and Birks (L. S. Birks) created the world’s first commercial X-ray fluorescence spectrometer. For decades, the technology of X-ray fluorescence spectrometers has developed rapidly, with new models characterized by speed, flexibility, and precision continuously emerging. X-ray fluorescence spectrometers are divided into two main categories: wavelength-dispersive X-ray fluorescence spectrometers and energy-dispersive X-ray fluorescence spectrometers. The former can be further divided into sequential and simultaneous types.
2.1 Sequential wavelength-dispersive X-ray fluorescence spectrometer
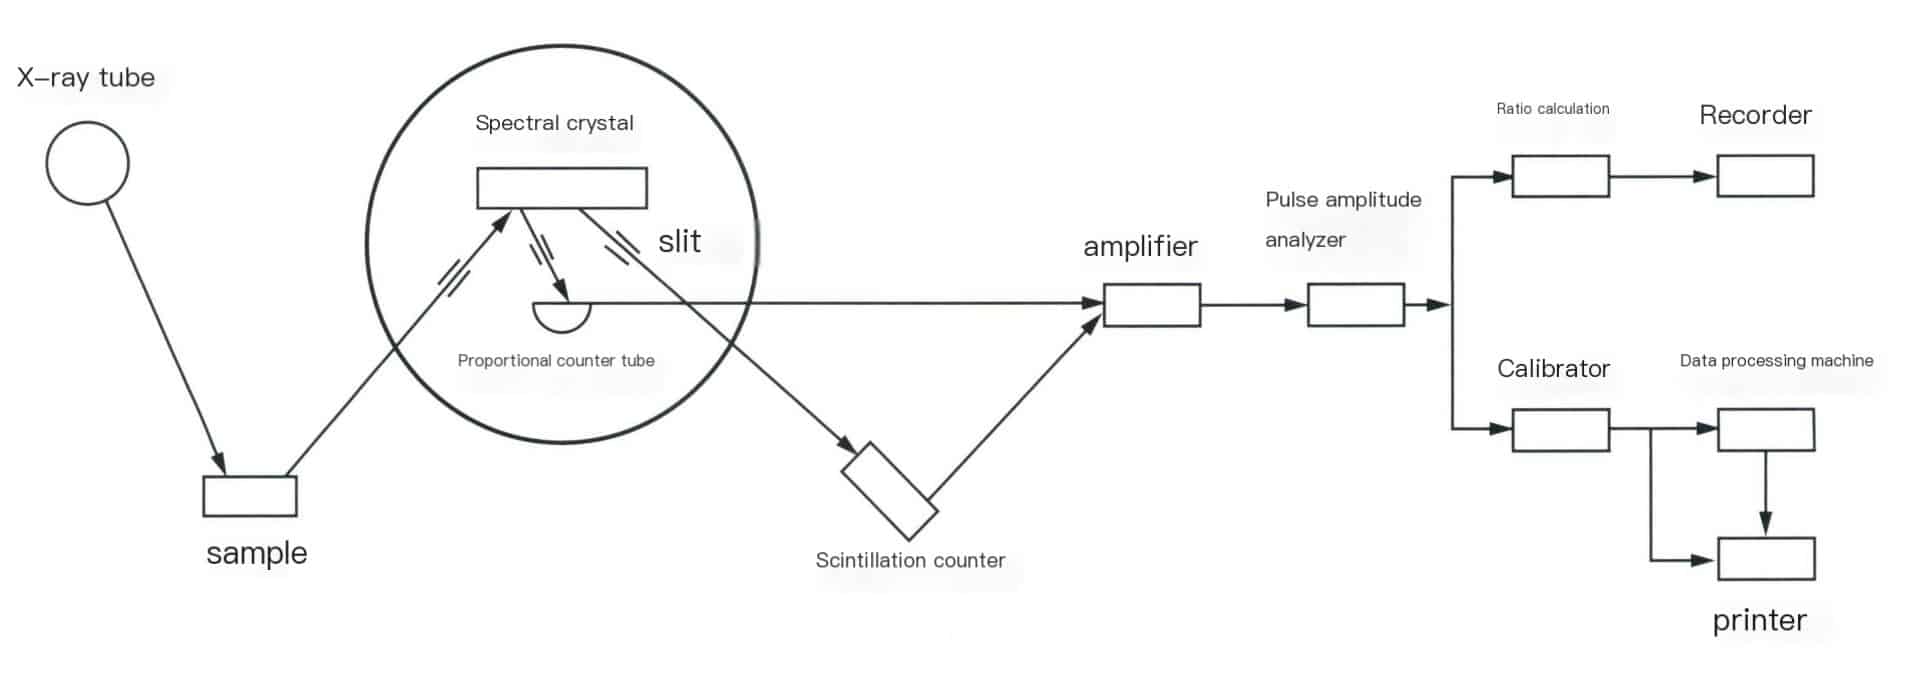
The sequential wavelength dispersive X-ray fluorescence spectrometer mainly consists of an X-ray tube, a spectroscopic system, a detection system, and a recording system. The structure of the instrument is shown in Figure 6-3.
(1) X-ray tube.
The X-ray tube is the device that generates X-rays, essentially a high-voltage vacuum diode, which includes a cathode that emits electrons and an anode (target) that receives electrons. Electrons bombard the anode target surface to produce X-rays, which are emitted from the window of the X-ray tube and irradiate the sample. Lightweight element materials are selected to reduce the absorption of X-rays of various wavelengths by the window, and commonly used X-ray tubes often use beryllium windows.
(2) Spectroscopic system.
It consists of several parts, including the sample chamber, slits, and spectroscopic crystals. The sample chamber is where the samples are stored, including components such as sample trays, boxes, sample holders, and sample rotation mechanisms. The samples can be solid (blocks, plates, rods, powders, etc.) or liquid. The slit, also known as a collimator or prism grating, serves to intercept the divergent X-rays generated from the sample, converting them into parallel beams that are projected onto the spectroscopic crystal or detector window. The role of the spectroscopic crystal is to separate or disperse spectral lines of different wavelengths. The basic principle of dispersion is to utilize the diffraction phenomenon of the crystal to separate characteristic spectral lines of different wavelengths, allowing for the selection of characteristic X-rays of the measured elements for determination.
(3) Detection system.
It receives X-rays and converts them into measurable or observable signals. Signals, such as visible light, electrical pulse signals, etc., are measured through electronic circuits. Common detectors in modern X-ray fluorescence spectrometers include scintillation counters, proportional counters, and semiconductor detectors.
Scintillation counter: It is a commonly used counter with high detection efficiency for short-wave X-rays, and its detection efficiency for heavier elements can be close to that of X-rays with wavelength less than 3A. It consists of a scintillator, photomultiplier tube, high-voltage power supply, and other components in the X-ray analysis of its energy resolution for heavy elements for 25%-30% and lighter elements for 50%-60%.
Proportional counter: Divided into closed proportional counters and gas-flow proportional counters.
Proportional counters are used to detect X-rays with wavelengths greater than 3A. Modern X-ray spectrometers commonly use gas-flow proportional counters. To reduce the absorption of long-wave X-rays, the aluminum-coated polyester film used as the detector window material is very thin (commonly 6um, but there are even thinner ones). The thin window cannot prevent gas leakage, so fresh gas is introduced to expel air using gas flow. P10 gas (90% argon, 10% methane) is the most widely used mixed gas. The energy resolution of proportional counters is better than that of scintillation counters.
Closed proportional counters permanently seal ionized gases, such as inert gases, oxygen, nitrogen, etc., to prevent gas leakage and are equipped with relatively thick beryllium or mica windows, with mica window thickness usually 12-15um. Other conditions are the same as those of gas-flow proportional counters.
Semiconductor detectors: Mainly used in energy dispersive spectrometers, their advantages are high detection efficiency and energy resolution, allowing energy detection from most characteristic spectra of light and heavy elements.
(4) Recording system.
Composed of an amplifier, pulse amplitude analyzer, and readout section. Amplifier: includes a preamplifier and a linear amplifier (the main amplifier). The pulse amplitude output from scintillation counters and proportional counters generally ranges from tens to hundreds of millivolts; weak electrical signals cannot be counted directly and must be amplified. The preamplifier amplifies first, usually by ten to several tens of times, and the main amplifier further amplifies the input signal pulses, resulting in pulse amplitudes that meet the requirements of the subsequent discrimination circuit, with amplification factors reaching 500-1000 times. Pulse amplitude analyzer: its function is to select a certain range of pulse amplitudes, allowing the analysis line’s pulses to be distinguished from interference and background while suppressing interference and reducing costs to improve the sensitivity and accuracy of the analysis. The readout section comprises a calibrator, ratio meter, printer, and other components.
2.2 Simultaneous automated X-ray fluorescence spectrometer (also known as multi-channel X-ray fluorescence spectrometer)
It comprises a series of single-channel instruments, each with its own crystal, collimator, detector, amplifier, pulse height analyzer, and counting calibrator arranged radially around a common X-ray tube and sample. Most channels are fixed, meaning they analyze specific element spectral lines at an angle of 20, equipped with the best components suitable for that element’s spectral line. This type of channel is called a fixed channel. Currently, instrument models with 22 channels, 28 channels, 30 channels, etc., can be seen. Another channel type is a scanning channel; a multi-channel spectrometer has 1-3 scanning channels, which have motor-driven mechanisms for qualitative analysis with 2ϴ scanning.
Multi-channel instruments can simultaneously determine various elements in a sample, making them suitable for analyzing a large number of similar samples. However, this type of instrument has a large structure, is expensive, and its application could be more extensive.
2.3 Energy dispersive X-ray fluorescence spectrometer
The comparison between wavelength dispersive X-ray fluorescence spectrometer and energy dispersive X-ray fluorescence spectrometer only lies in the difference in separating (dispersing) the characteristic X-rays emitted from the sample. The former uses crystals for spectroscopy, while the latter commonly uses a semiconductor detector with high energy resolution and a multi-channel pulse amplitude analyzer for energy screening analysis. The structure of a modern energy-dispersive X spectrometer is shown in Figure 6-4.
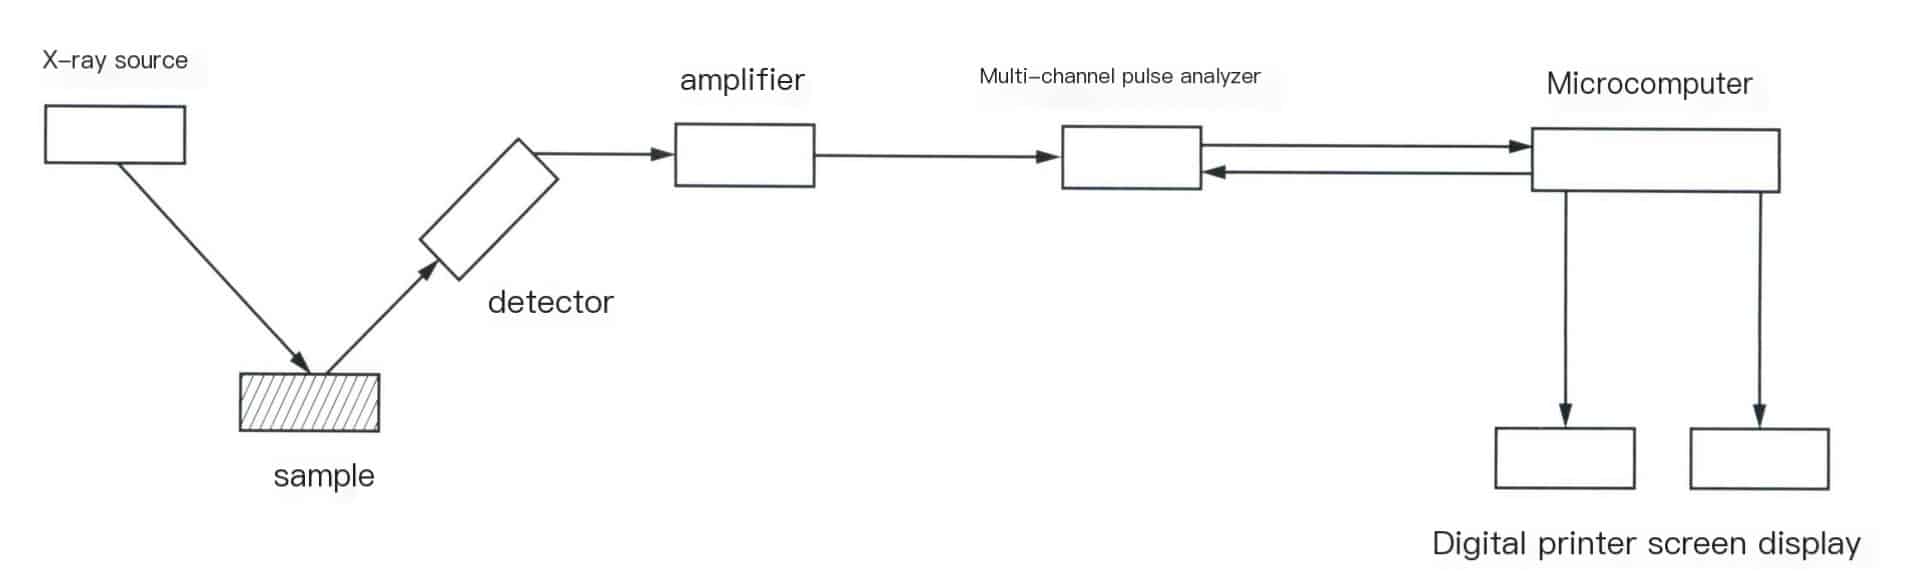
In energy-dispersive X-ray fluorescence spectrometers, the X-ray source can be an X-ray tube or a radioactive isotope as the excitation source. The characteristic X-rays emitted by the sample are sent to a semiconductor detector [commonly used Si(Li) detector] for detection, resulting in a series of current pulses proportional to the amplitude and photon energy. After amplifying the output of the detector, it is sent to a multichannel pulse height analyzer for pulse analysis. The various pulse height distributions obtained are displayed or recorded as energy spectra, where the displayed image is a spectrum of intensity versus pulse height or intensity versus photon energy. The concentration (content) of elements is determined based on the height of the energy spectrum peaks.
Since, in most cases, radioactive isotopes are used as excitation sources, this type of X-ray is also known as a “soft” XX-ray. The energy-dispersive X-ray fluorescence spectrometer made with “soft” X-rays is lightweight because it eliminates a lot of components and systems related to the X-ray source.
3. Characteristics of X-ray fluorescence spectroscopic analysis
3.1 Advantages
(1) A wide range of elements can be analyzed; almost all of the first 92 elements in the periodic table can be analyzed.
(2) The range of element content that can be analyzed is quite broad, from a few hundred thousandths to 100%, with precision comparable to other detection methods.
(3) This method is a non-destructive analytical method, meaning the sample will not be damaged during the analysis process, will not cause changes in chemical state, and will not result in sample dispersion. The same sample can be measured repeatedly, meeting the detection needs of precious metal jewelry. It is particularly suitable for the quality assessment and authenticity verification of precious metal products.
(4) The analysis speed is fast. The time required for measurement is related to the precision of the measurement, but it is generally very short, and all the elements to be measured in the sample can be completed in 2-5 minutes.
(5) It is independent of the analytical sample’s morphology and chemical bonding state; solid samples, liquids, pressed blocks, powders, films, or samples of any size can be analyzed.
(6) The analysis cost is low, and the professional background and technical proficiency required of the operators are not high.
3.2 Limitations
(1) Non-metallic elements and those between metals and non-metals are difficult to detect accurately. When testing with basic parameter methods, errors will occur if the test sample contains light elements such as C, H, or O.
(2) Representative samples are needed to create standard curves, and the accuracy of the analysis results is based on the chemical analysis of standard samples, which can easily be affected by interference from other elements and overlapping peaks. The standard curve model needs to be updated occasionally; when there are changes in the instrument or standard samples, the standard curve model must also change.
(3) There is a potential contamination threat from radioactive isotope sources.
(4) The XRF method has a large detection error for gold jewelry with different matrices, does not consider the properties and uniformity of the samples, and especially cannot make accurate detections for surface-treated gold jewelry and gold-plated items. The limitation of the density method is that if the alloy type is judged incorrectly, it can lead to significant errors or even incorrect conclusions. However, if the relative proportions of the alloy type and impurity elements are known in advance, its measurement accuracy surpasses that of other methods. Therefore, in specific applications, combining the density method and X-ray fluorescence spectroscopy is a very effective approach, where the two methods complement each other for verification: using X-ray fluorescence spectroscopy to detect the alloy type, roughly measuring the relative proportions of various impurity elements, and then using the density method to determine their content is widely applied in jewelry quality inspection stations, provided that the precious metal is a uniform alloy and not gold-plated or gold-filled.
4. Qualitative and Quantitative Analysis Methods of X-ray Fluorescence Spectrometer
4.1 Prepare the sample
Before analysis, check the sample’s variety, marks, appearance, etc.; samples with dirty surfaces should be wiped clean to ensure the measurement surface is contaminant-free.
In addition to testing institutions, jewelry companies extensively use X-ray fluorescence spectrometers to monitor the quality of materials and products during production. The samples to be analyzed can be solid or aqueous solutions, and the state of the sample affects the measurement error. Solid samples must have clean surfaces that are free of contaminants. For solid precious metal samples, attention should be paid to errors caused by component segregation. For example, due to segregation, jewelry castings made from the same gold tree but located at different positions may have different qualities. Samples with the same chemical composition but heat treatment processes will yield different counting rates. For non-uniform precious metal samples, they should be remelted to achieve uniformity, quickly cooled, and then rolled into sheets or taken from their fracture; uneven surface samples should be polished flat; for powder samples, they should be ground to 300-400 mesh and then pressed into discs, or placed in sample holders for measurement. Liquid samples can be dropped onto filter paper, and after drying the moisture with an infrared lamp, they can be measured or sealed in sample holders.
4.2 Qualitative analysis to determine the main elements and impurity components of the sample
Different elements have their specific wavelengths or energies of fluorescent X-rays, so the composition of the elements can be determined based on the wavelength or energy of the fluorescent X-rays. If it is a wavelength-dispersive spectrometer, the wavelength λ of the X-rays can be determined from the angle 2ϴ at which the detector rotates for a crystal with a certain interplanar spacing, thus determining the elemental composition. For energy-dispersive spectrometers, the energy can be identified by channels, thus determining which elements and components are present. However, manual identification is still required if the element content is too low or there is spectral line interference between elements. First, identify the target material of the X-ray tube. Measure X-ray and accompanying lines of strong peaks, then label the remaining spectral lines based on energy. When analyzing unknown spectral lines, factors such as the source and properties of the sample must be considered to make a comprehensive judgment.
4.3 Select standard samples and draw calibration curves
Based on the results of the qualitative analysis, select standard samples that match the purity level and impurity components. Generally, the following requirements apply:
(1) The types of elements in the standard sample must be similar to those in the unknown sample and should be the same.
(2) The content of all components in the standard sample must be known.
(3) The content range of the measured elements in the standard sample should include all the measured elements in the unknown sample.
(4) The state of the standard sample (such as the particle size of powder samples, the surface smoothness of solid samples, and the chemical state of the measured elements, etc.) should be consistent with the unknown sample, or it should be able to be processed to be consistent by appropriate methods.
Testing of specimens, each measured no less than three times. After repeated measurements, calculate the average value and then use the standard values of each element’s content and the corresponding average values as parameters to plot the calibration curve and derive the linear equation. Generally, laboratories should regularly verify the calibration curve.
4.4 Detect samples and calculate quantitative analysis results
The sample is tested in a sample chamber and quantitatively analyzed by X-ray fluorescence spectrometry, which is based on the fact that the fluorescence X-ray intensity of an element Ii , is directly proportional to the amount of that element in the sample Ci
Ii = Is x Ci
In the formula, Is is the fluorescence X-ray intensity of the element when Ci =100%.
According to the above formula, quantitative analysis can be performed using standard curve methods, incremental methods, internal standard methods, etc. However, these methods require that the composition of the standard sample be as similar as possible to that of the test sample; otherwise, the matrix effect of the test sample refers to the changes in the basic chemical composition and physical and chemical state of the sample, which affect the intensity of the X-ray fluorescence. Changes in chemical composition can affect the sample’s absorption of primary X-rays and X-ray fluorescence and can also alter the fluorescence enhancement effect.
Based on the calibration curve, substitute the measured values into the linear equation of the calibration curve to calculate the corrected value of the sample measurement. For each sample, select no less than three representative test values from different locations and calculate their average through repeated measurements.
5. Affecting the Detection Accuracy of the XRF Method
XRF utilizes the relationship between the fluorescent intensity of elements and their content in many standard substances with similar properties to establish a mathematical calibration curve and then determines the content by measuring the fluorescent intensity of elements in unknown samples. To obtain highly accurate detection results, establishing the standard working curve and choosing calculation methods are very important.
5.1 Standard Working Curve
Standard substances (standard samples) are the basis for establishing standard working curves. However, there currently needs to be more commercially available standard substances for precious metal jewelry in the domestic market, and the types of impurities in precious metal ornaments are diverse. It is difficult to meet the requirements for standard substances that match the impurity composition, as they rely solely on commercially available national standard substances. This leads to significant deviations in analytical results due to matrix effects. For example, in the calibration of the gold series standard substances, if there are no impurity elements like nickel, then using an X-ray fluorescence spectrometer to measure nickel-containing white K gold will inevitably result in errors.
When establishing a working curve for fitting, it is essential to reasonably select correction elements. Whether enhancement, absorption, overlap, or interference, one must consider the calculated errors after curve fitting and the actual testing deviations of standard samples to determine whether the selected elements and methods are truly effective.
The most important criterion during curve fitting is that the apparent content points on the curve should be similar to the recommended value points. The calculated correction coefficients should have positive and negative values so that the results of actual tests can be closer to their true values, making the measurement data authentic and reliable.
5.2 Selection of Calculation Methods
X-ray fluorescence spectroscopy commonly uses three quantitative analysis methods: direct method, difference method, and normalization method.
(1) Direct Method. It calculates the content of Au by substituting the intensity of Au into the corresponding intensity and content linear relationship equation.
(2) Difference Method. It obtains the content of the main element by directly subtracting the content of impurity elements from the total amount of 100%.
(3) Normalization Method. It assumes the normalized content to be 100%, sums the content values of each element, and compares it with 100%. The excess part is weighted for each element to derive the final content values of each element.
When the content of the precious metal element to be tested is greater than 75%, the linear relationship between the main element content and intensity becomes weaker, and the results obtained directly from the linear relationship tend to be inaccurate. Switching to the linear relationship of impurity elements can yield relatively accurate impurity element content. Using the normalization method or the difference subtraction method can provide more accurate main element content. When the content of precious metal elements is less than 75%, using the linear relationship between the intensity and content of Au directly for calculations yields more accurate results.
Copywrite @ Sobling.Jewelry - Producent biżuterii na zamówienie, fabryka biżuterii OEM i ODM
Section V Fire Assay Method (Cupellation Method)
Fire assay, also known as the cupellation method, determines the content of precious metal components in minerals and metal products through melting and roasting. Fire assay is not only an ancient means of enriching gold and silver but also an important method for gold and silver analysis. Geological, mining, and gold and silver smelting industries, both domestically and internationally, widely apply it as the most reliable analytical method in production.
Fire assay is internationally recognized as the most accurate method. Several countries have designated it as a national standard, and it has become the internationally designated arbitration method for determining gold content. China’s standard “Regulations and Naming Methods for the Purity of Precious Metals in Jewelry” (GB 11887-2012) also designates fire assay as the arbitration method for measuring gold content in gold alloys.
1. Principle of Fire Assay Method
Weigh a certain mass of the gold sample to be analyzed, add an appropriate amount of silver, wrap it in lead foil, and melt it at a high temperature. The molten lead can capture gold, silver, and precious metals, completely dissolving the exposed gold and silver in the molten state. The lead in the molten alloy is easily oxidized in air or oxygen, forming molten lead oxide. The surface tension and relative density of lead oxide differ from molten lead, causing the molten lead to sink to the bottom and form a lead button. At the same time, the porous ash dish absorbs the molten lead oxide due to its wetting properties and capillary action. The cohesive force of molten lead is strong and is not absorbed by the ash dish. After the molten lead oxide seeps into the ash dish, the molten lead exposes a new surface and is oxidized again, and the ash dish absorbs the newly formed molten lead oxide. This process continues repeatedly until all the lead is oxidized into lead oxide and absorbed by the ash dish, achieving good separation of the lead button and the slag. During this process, other base metal elements may also partially or completely form volatile oxides or be absorbed by the ash dish, achieving the goal of removing impurity elements and obtaining purer precious metal particles. After the ash blowing, the alloy particles are treated using the property that silver dissolves in nitric acid while gold does not, dissolving the silver in nitric acid and separating the gold. The gold content of the sample is calculated after weighing the gold separated from nitric acid and correcting it with a pure gold standard sample measured simultaneously.
2. Advantages and Disadvantages of Fire Assay
2.1 Advantages
(1) The fire assay method has a wide range of applications and can be used to determine the gold content in various gold and K gold jewelry with gold content between 333.0% and 999.5%. It is recognized as a classic testing method in jewelry industry testing institutions.
(2) The analysis results are reliable, with high precision and accuracy.
(3) The sample size is large and representative, which can significantly reduce sampling errors.
2.2 Disadvantages
(1) It is a destructive method requiring the destruction of samples for testing, resulting in high detection costs.
(2) It is not suitable for samples of high-purity gold jewelry (gold content above 999.5%) and samples containing impurities that are insoluble in nitric acid (such as Ir, Pt, Rh, etc.).
(3) The ash fusion process requires using the harmful element Pb as a collector, posing safety risks to the health of inspectors and the environment.
(4) The analysis process is lengthy, with many experimental steps and complex operations, requiring a high level of professional skills and experience from the experimental personnel.
3. Equipment and utensils used in the fire assay method
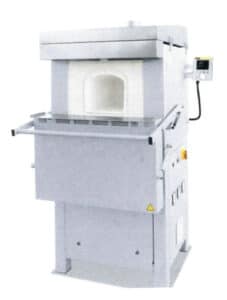
3.1 Ash Blowout Furnace
The high-temperature Ash Blowout Furnace is used for fire assay (a muffle furnace). The muffle furnace specifically designed for ash blowing should have air intake and exhaust ports to allow for air circulation, preferably capable of preheating the air and ensuring stable passage, as shown in Figure 6-5, with the furnace temperature able to be evenly heated from room temperature to 1100℃.
3.2 Analytical Balance
The fire assay method is a quality analysis method that has strict requirements for the analytical balance, generally requiring a sensitivity of precision analytical balance within 0.01mg. The balance and weights must be calibrated regularly, with calibration cycles ideally set to 1 month or one quarter, depending on the workload.
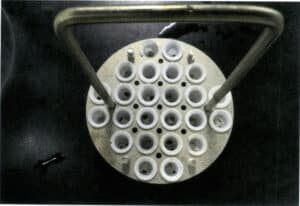
3.3 Gold Separation Basket
The materials used to make gold separation baskets vary by country. In China, assay laboratories often use platinum or stainless steel plates, as shown in Figure 6-6.
3.4 Rolling Mill
Used to compress the alloy into thin sheets, requiring the thickness of the rolled sheets to be uniform and consistent to avoid increasing analytical errors.
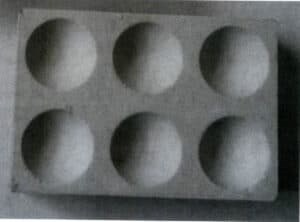
3.5 Ash Dish
The ash dish is a porous refractory vessel that absorbs lead oxide during the lead-blowing process. Common ash dishes include cement ash dishes, bone ash cement ash dishes, and magnesia ash dishes (Figure 6-7).
4. Analysis Steps of Fire Assay
Taking gold alloy jewelry with gold content between 333.0% and 999.5% as an example, the process of analyzing its gold content is mainly divided into eight steps: pre-analysis, weighing, silver replenishment, lead cladding, ash blowing, rolling, gold separation and calculation of results.
4.1 Pre-analysis
Common pre-analysis methods include the weight method and X-ray fluorescence spectroscopy (XRF). The weight method has higher accuracy for pre-analysis but takes longer. The XRF method is fast and can simultaneously analyze the impurity element content in the sample, but it has a larger margin of error. For general samples, XRF can be used for pre-analysis to understand the basic composition of the sample, facilitating the calculation of the quality of standard samples of silver, copper, nickel, etc. For irregular shapes or samples with larger XRF analysis errors, the weight method can be used for pre-analysis.
4.2 Weighing
Weigh 200-300mg standard gold samples in three or four portions and three or four portions of test samples equivalent to the standard gold quality, accurate to 0.01mg. The samples should be cut into small pieces, mixed evenly, and weighed to make the weighing more representative. The weighing of standard gold and samples should follow the principle of consistency, with the component ratios as similar as possible. The weighing deviation between parallel standard gold and parallel samples should be controlled within 2%.
4.3 Silver replenishment
When supplementing silver, the ratio of silver to gold is crucial. If silver is less than twice the amount of gold, the gold separation cannot proceed. A large ratio of gold to silver can easily cause the gold roll to break. It is more appropriate for the amount of silver to be 2.1-2.5 times that of gold. The extremely poor silver amount should be controlled within 1%. Considering the total amount of base metals contained in the sample, an appropriate amount of copper should be added proportionally to the standard gold.
4.4 Lead cladding
Wrap the weighed standard gold and sample separately in lead foil, roll them up, and number them. The weight of the lead foil is generally 3.5g, and the lead packaging amount for the standard gold and sample should be as consistent as possible. The amount of lead is proportional to the impurity content of the sample; if the copper and nickel content is high, the amount of lead can be increased. The lead and sample should be tightly wrapped to minimize gaps, avoiding splashing losses caused by air expansion after the lead is placed, as shown in Figure 6-8.
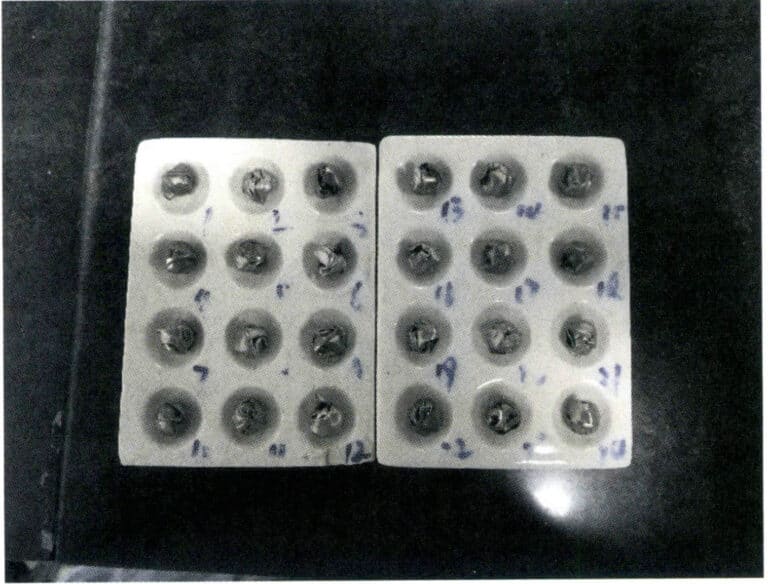
Note: The numbers in the figure are sample numbers; the same applies below
4.5 Ash blowing
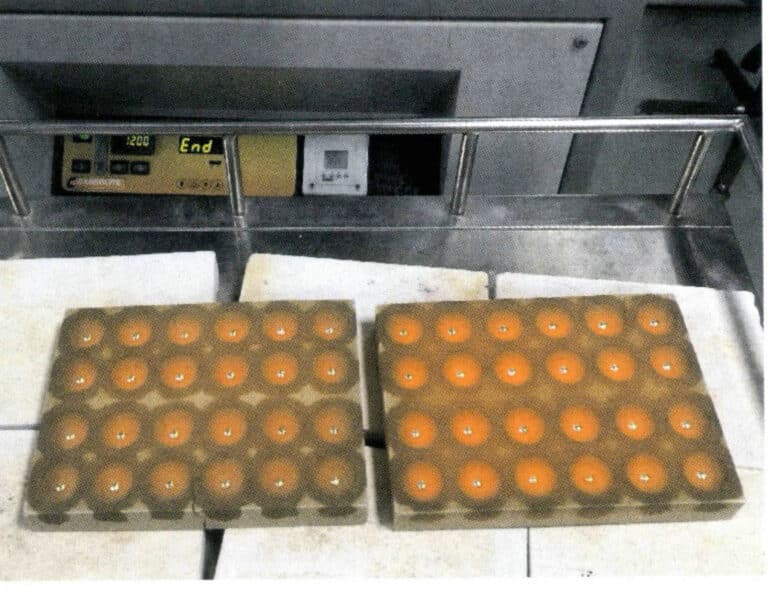
Place the standard gold wrapped in lead foil and the sample into the ash-blowing furnace, arranging the standard gold and sample in a cross pattern to avoid temperature discrepancies. The crucible should be preheated to above 920℃ to prevent residual organic matter and other volatiles from causing splattering. Maintain the furnace temperature at 920-1000℃, and continue heating in an oxidizing atmosphere until the sample completely melts, for about 25 minutes. If using a closed ash-blowing furnace, after maintaining it at 920-1000℃ for 30-40 min, slightly open the furnace door for oxidizing ash blowing, and close it after 10-15 min.
After ash blowing is complete, stop heating and allow the furnace to cool down to below 700℃ before removing it, as shown in Figure 6-9, to avoid rapid cooling that could cause rapid oxidation of the agglomerates, leading to splattering and spiking.
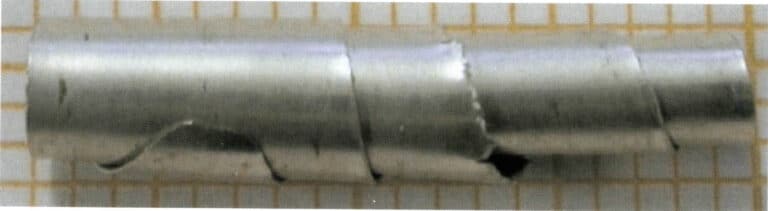
4.6 Rolling
Use a brush to remove the ash materials adhered to the alloy particles, flatten them on an anvil (Figure 6-10), and then anneal at 700℃. Use a rolling mill to roll the alloy particles into thin sheets of 0.15-0.2 mm (Figure 6-11), and then anneal again, avoiding excessive time. The direction in which the alloy particles are fed during rolling should be consistent to prevent sample cracking and loss. The thickness of the rolled sheets should be uniform to ensure consistency in value addition. Use a digital steel stamp to mark and roll into a cylindrical shape (Figure 6-12).
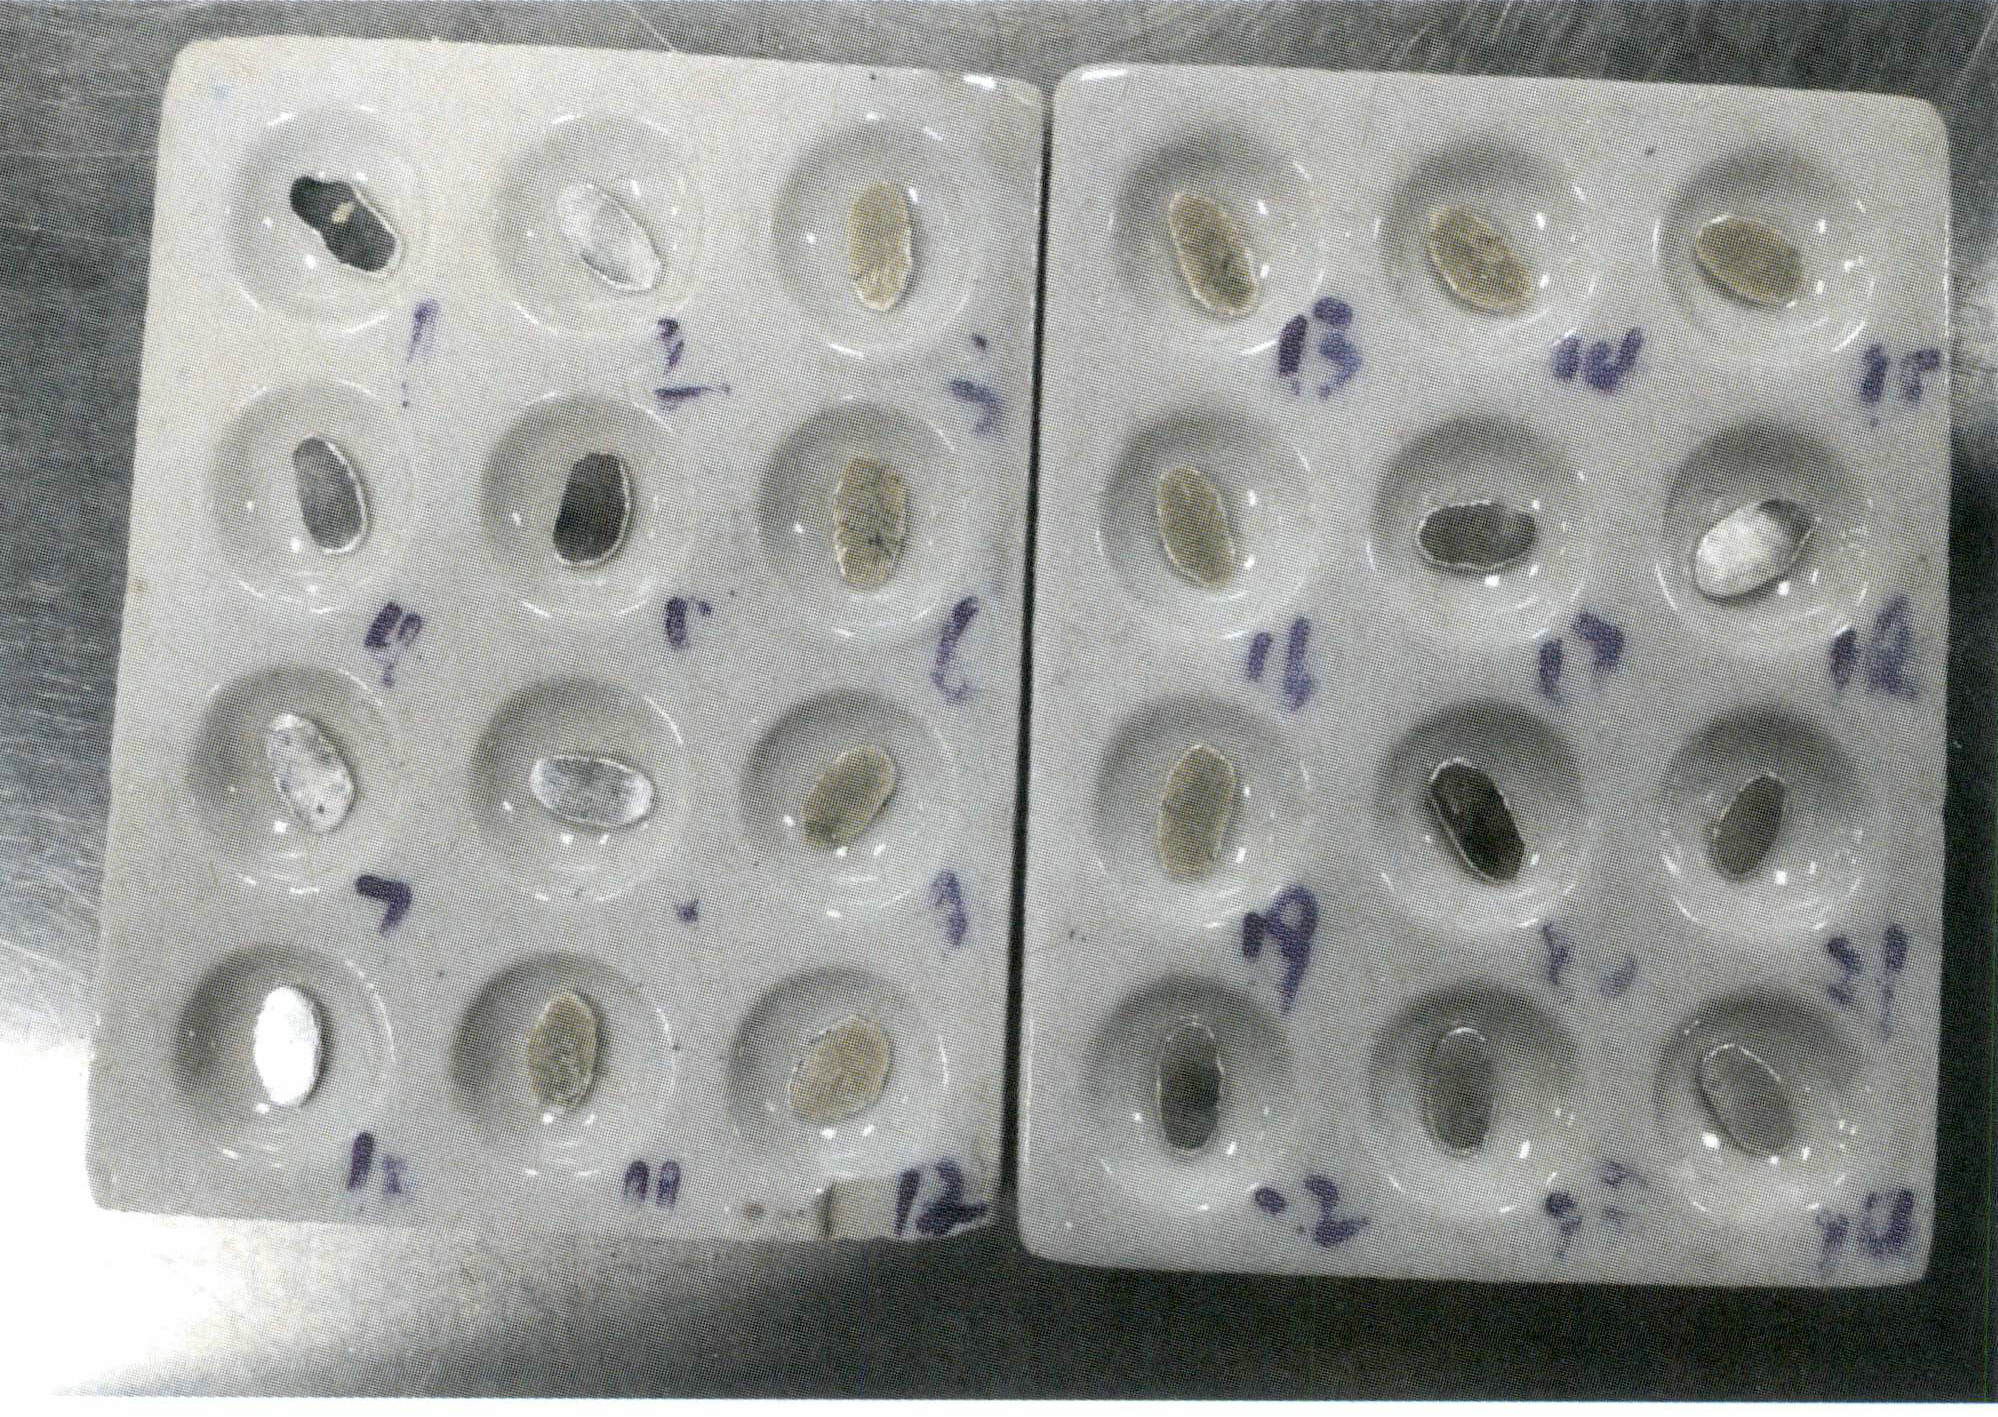
Figure 6-10 Flattening the alloy particles
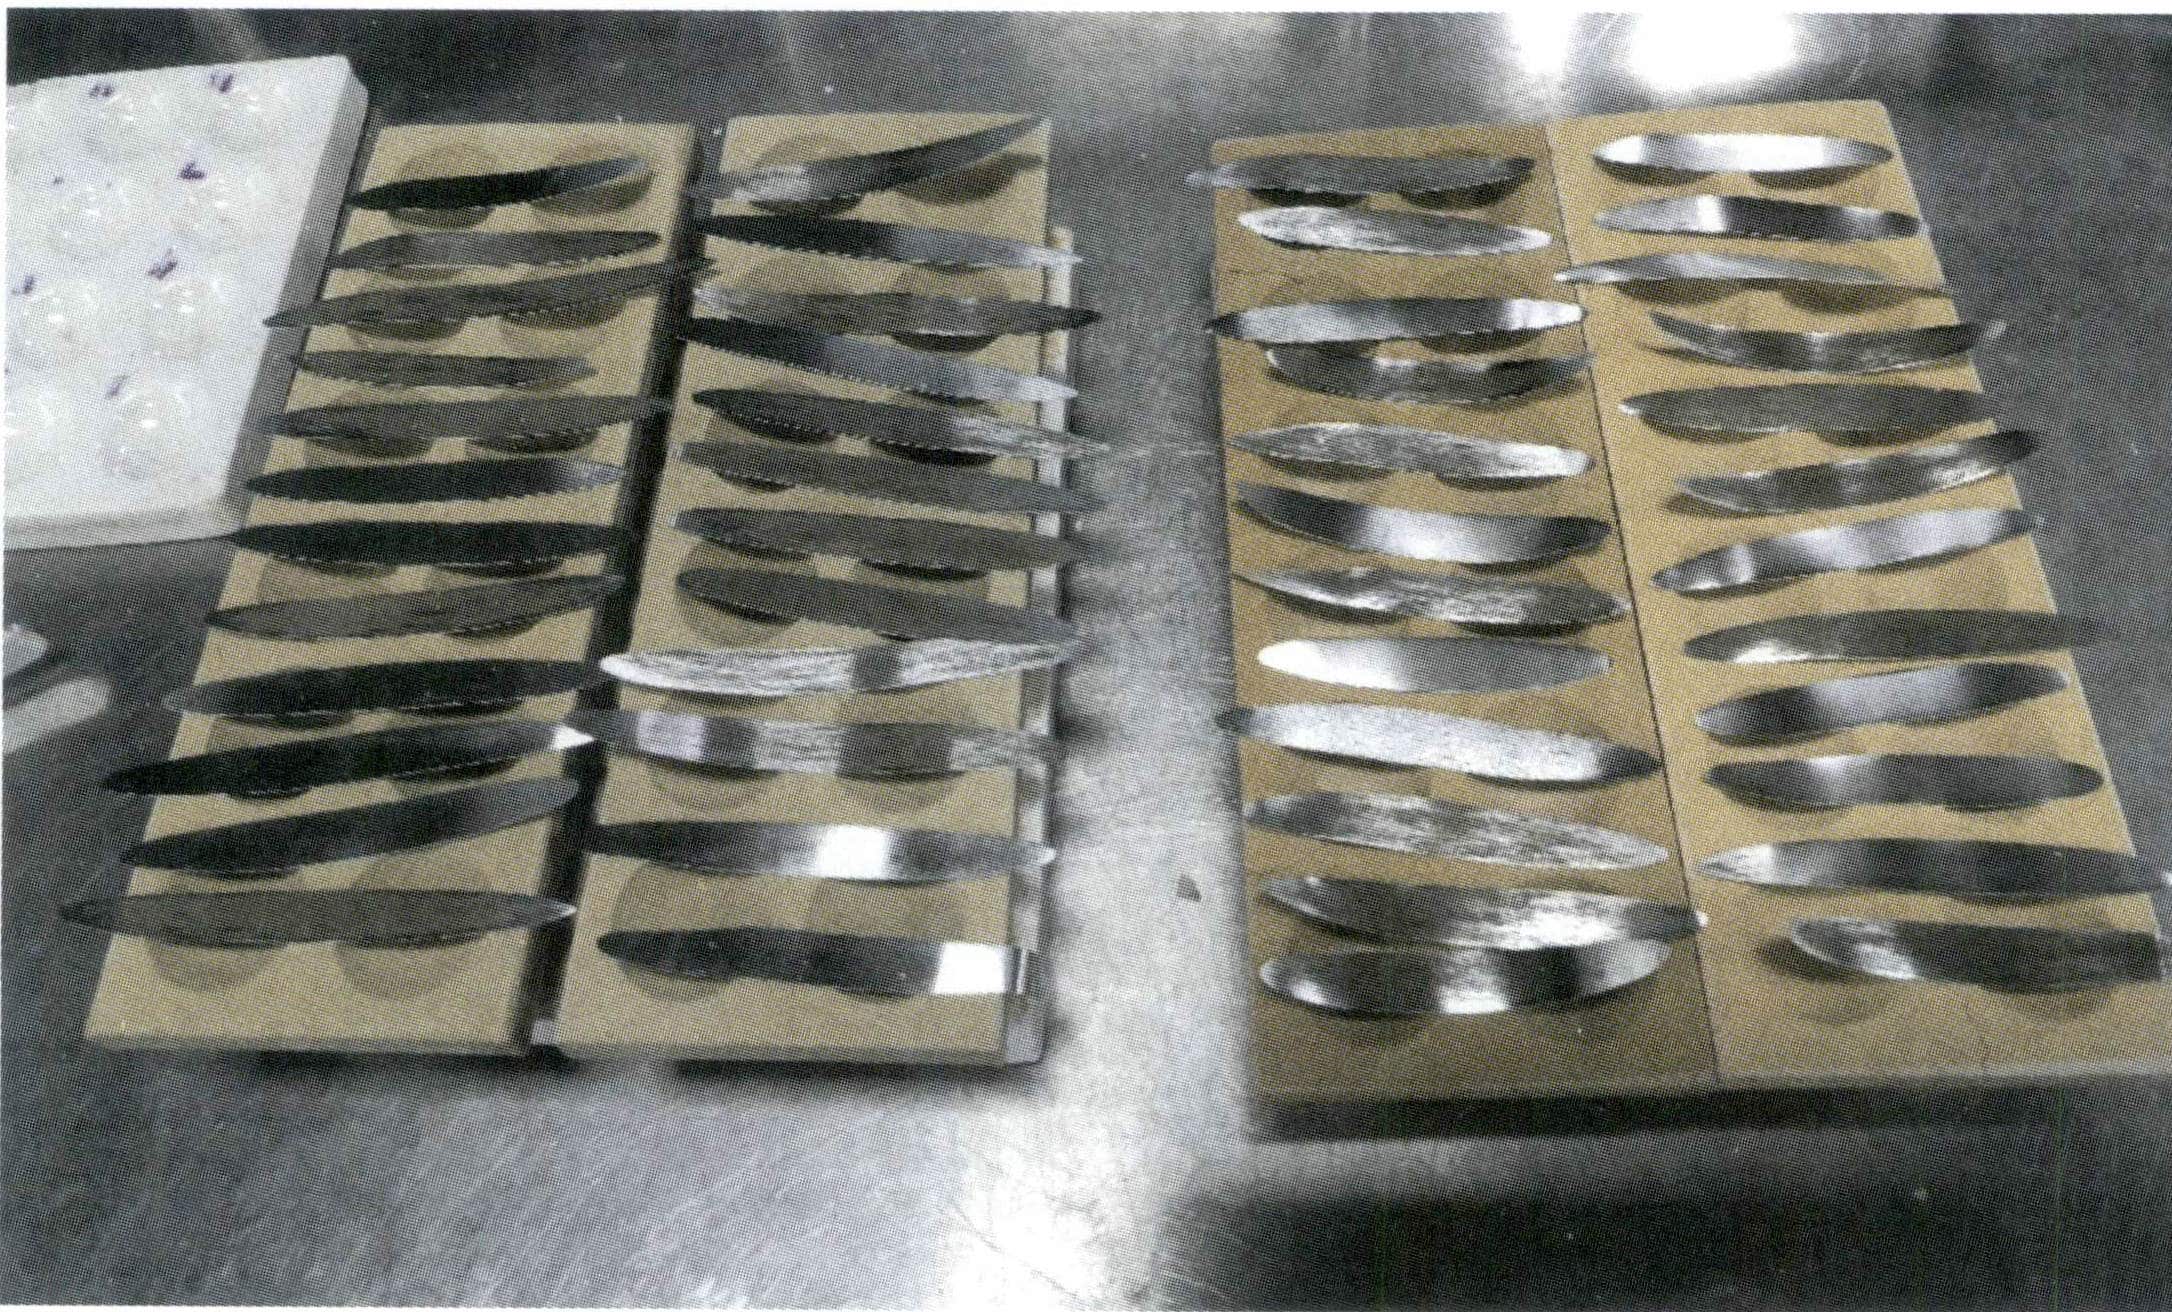
Figure 6-11 Rolling thin sheets
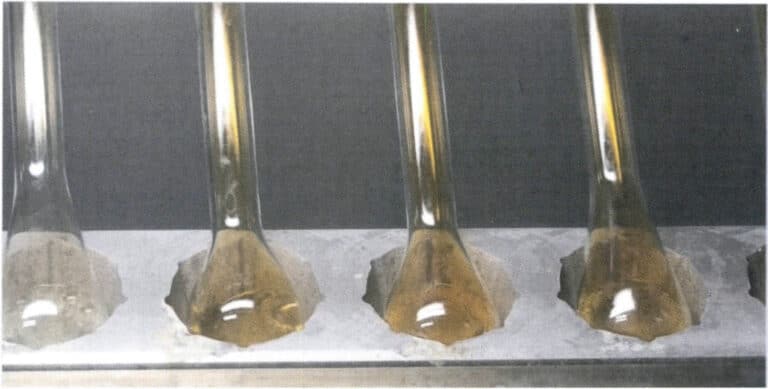
4.7 Gold Separation
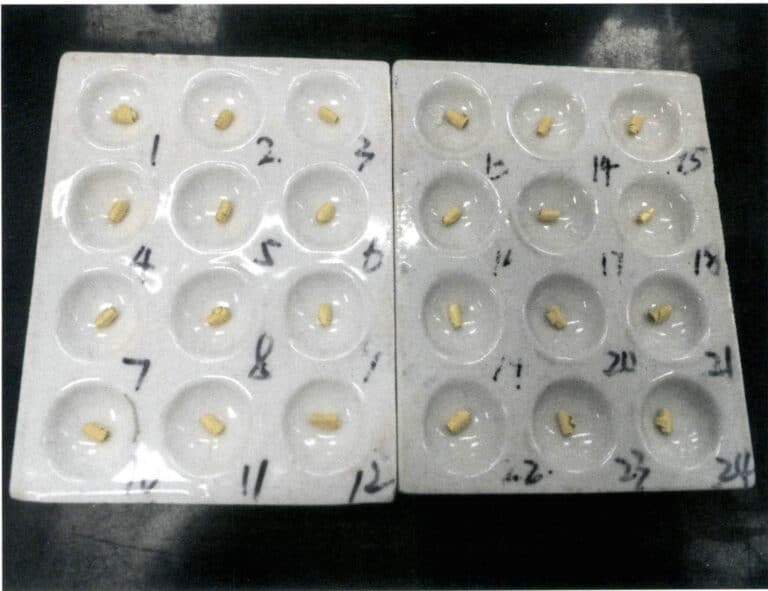
Use nitric acid to dissolve silver from the gold alloy roll. Before separating the gold, clean the alloy roll, flask, or basket to prevent contamination or the introduction of chloride ions. Immerse the gold roll in a separation flask containing 20mL of near-boiling nitric acid, keeping it always below the boiling point at a temperature close to boiling, and heat continuously for 15 minutes or until the nitrogen oxide salt mist is driven off, as shown in Figure 6-13. Slowly pour out the solution, wash the gold roll with hot water 3-5 times, and then immerse it in boiling nitric acid and wash it again.
Carefully transfer the standard gold after separation to a porcelain crucible, dry it, and burn it to a golden yellow, as shown in Figure 6-14. After cooling, weigh the mass of the gold roll, which is accurate at 0.01mg.
4.8 Calculation result
Gold content Wt(Au) is calculated according to formula (6-3), with the result rounded to one decimal place:

W formule:
m1 – sample mass (g);
m2 – a mass of the gold obtained after separating from the sample (g);
m3 – a mass of standard gold (g);
m4 – The quality (g) of the gold ingot obtained after standard gold analysis;
E – The purity of standard gold (‰).
The deviation in results caused by repeated experiments should be less than 0.2‰ for 999.0‰-999.5‰; Gold alloys should be less than 999.0‰ and less than 0.5‰; white K gold should be less than 1‰.
5. Factors Affecting the Accuracy of Fire Assay Analysis
When applying fire assay to analyze gold content, factors such as sample size, type of cupel furnace, material of the cupel, silver to gold ratio, cupellation temperature, and separation time will all affect the results. It is necessary to conduct accompanying experiments using gold standard samples and maintain consistency in the analysis conditions of the gold standard samples and the samples to obtain good parallelism and accurate, reliable results, eliminating systematic errors in the analysis process.
5.1 Sample Size
The sample size for analyzing K gold jewelry is generally small, related to the high content of alloying elements in K gold jewelry. However, a sample size that is too small will directly affect the sample’s representativeness and the analysis’s accuracy. The sample size can be appropriately increased for jewelry with higher purity and lower nickel and copper content for better results. For lower-grade K gold, the amount of lead foil can be appropriately increased to facilitate the separation of impurities. The standard gold appreciation should have a certain range of control and trade-offs to avoid systematic deviations.
5.2 Ash blowing Furnace
A regular muffle furnace can only meet the temperature requirements. It cannot provide the oxidizing gas flow needed during the cupellation process, which reduces the quality and effectiveness of the cupellation. Additionally, it poses certain safety hazards: to provide the oxygen required for oxidation, the furnace door must be opened slightly during the cupellation stage, causing a large amount of lead oxide to escape from the furnace door, resulting in serious lead contamination of the surrounding environment and endangering the health of the operators. Furthermore, prolonged use can lead to corrosion damage of the furnace chamber and opening by lead oxide, and the large amount of lead residue inside the furnace is difficult to discharge in time, which can easily contaminate the analysis samples. Therefore, a dedicated cupellation furnace should be prioritized.
5.3 Ashtray Material
When selecting the material and ratio for ashtrays, it is important to consider not only the ashtray’s ability to absorb impurity elements in the lead but also the recovery rate of gold and silver during the ash-blowing process. Magnesia ashtrays have a relatively high recovery rate, but there are issues with removing adhered particles at the bottom and determining the ash-blowing temperature and endpoint. Bone ash and cement ashtrays make it easier to judge and control the ash-blowing temperature and endpoint, resulting in purer aggregates that are less likely to break when struck into thin sheets. However, the recovery rate is relatively lower.
5.4 Silver to Gold Ratio
Silver has two roles in fire assay: extraction, which extracts gold from impurities, and protection, which reduces gold loss during the measurement process. A small amount of silver can increase gold loss and incomplete oxidation during ash blowing, but more silver is not always better. When the amount of silver added is three times the weight of gold, gold loss increases, and the gold can easily break during separation. Generally, the amount of silver added is related to the sample’s composition. During ash blowing, when nickel and palladium in white K gold alloys are captured, gold can also be lost, so a larger amount of silver is usually required as a protective agent to prevent gold loss. When analyzing gold content using fire assay for white gold alloys containing nickel but not palladium, nickel should be added to the standard gold in quantity roughly equivalent to the sample, and the amount of lead should be increased. For white gold alloys containing palladium, palladium should be added to the standard gold in a quantity roughly equivalent to the sample while increasing the lead amount.
5.5 Ash Blowing Temperature
Taking 18K gold as an example, under the same process conditions, when the ash-blowing temperature is within the 900-1500℃ range, the standard gold loss increases with the rise in ash-blowing temperature and shows a linear distribution. When the ash-blowing temperature is too high, silver is prone to evaporation and splashing, leading to increased errors in the analysis results; when the ash-blowing temperature is too low, the molten lead oxide and impurities may also clump together, which cannot be fully absorbed by the crucible, resulting in the analysis process being unable to proceed.
5.6 Gold Separation Time
Taking 18K white gold as an example, the gold measurement results decrease as the gold separation time increases, but after reaching a certain level, the gold measurement results remain unchanged.
Section VI Inductively Coupled Plasma Emission Spectroscopy (ICP Method)
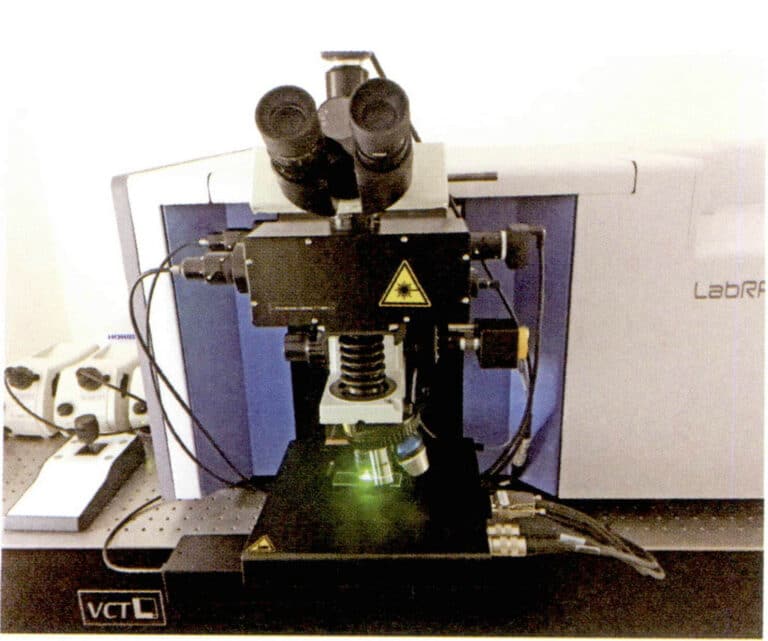
The inductively coupled plasma emission spectrometer, also known as the ICP spectrometer or ICP atomic emission spectrometer, uses inductively coupled high-frequency plasma as the excitation light source, utilizing the characteristic emission spectra of each element’s atoms or ions to determine the composition of substances and conduct qualitative and quantitative analysis of elements. ICP discharge is a relatively simple and highly effective method that transforms aerosols and vapors of liquids and solids, as well as gases at normal pressure, into free atoms, excited state atoms, and ions or molecular fragments. It can quickly analyze various major, trace, and ultra-trace elements in materials. It is one of the most competitive methods for simultaneous multi-element analysis, characterized by a wide testing range, fast analysis speed, and low detection limits. It has high precision and accuracy for detecting high-content gold and is a commonly used method by jewelry industry testing institutions for determining high-content gold jewelry materials.
1. Principle of the ICP Method
The working principle of the ICP method is shown in Figure 6-15.
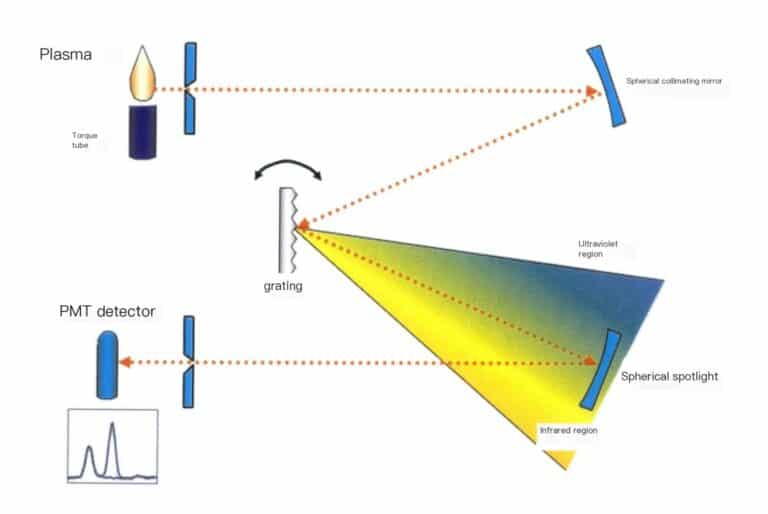
The high-frequency power generated by the radio frequency generator is applied to the three-layer concentric quartz torch tube through the induction working coil, forming a high-frequency oscillating electromagnetic field; argon gas is introduced into the outer layer of the quartz torch tube, and high-voltage discharge is performed to generate charged particles. The charged particles move back and forth in the high-frequency electromagnetic field, colliding with other argon ions, producing more charged particles. At the same time, the temperature rises ultimately forming argon plasma, with temperatures reaching 6000-8000 K. The sample of the aqueous solution to be tested is passed through the atomizer. The formed aerosol enters the central channel of the quartz torch tube, where it is fully evaporated, atomized, and ionized in high temperature and inert gas, emitting characteristic spectral lines of the elements contained in the solution; by collecting light from the plasma light source and using a scanning spectrometer for scanning, the light intensity of the characteristic spectral lines of the elements to be tested is accurately positioned at the exit slit. The light intensity of the spectral line is converted into photoelectric current using a photomultiplier tube. After circuit processing and analog-to-digital conversion, it enters the computer for data processing. The presence or absence of characteristic spectral lines identifies whether a certain element is present in the sample (qualitative analysis); based on the intensity of the characteristic spectral lines determines the content of the corresponding element in the sample (quantitative analysis).
2. Advantages and Disadvantages of the ICP Method
2.1 Advantages
(1) Ability to detect multiple elements simultaneously. It can detect multiple elements in the same sample at the same time. Once the sample is excited, each element emits its characteristic spectral lines, allowing for separate detection while simultaneously determining multiple elements.
(2) Fast analysis speed. Most samples can be analyzed without chemical treatment, and solid and liquid samples can be analyzed directly. Additionally, multiple elements can be determined simultaneously. Using a photonic direct-reading spectrometer, the quantitative determination of dozens of elements can be completed within minutes.
(3) Good selectivity. Due to the strong characteristic of the spectrum, it is particularly significant for analyzing elements with very similar chemical properties. For example, analyzing dozens of rare earth elements in Nb and Ta, Zr, and Hf is very difficult compared to other methods. At the same time, emission spectroscopy can easily distinguish and measure them.
(4) Low detection limit. The detection limit of a general light source is (0.1-10) x 10-6, with an absolute value of (0.01-1) 10-6; while using an inductively coupled plasma (ICP) light source, the detection limit can be as low as 10-9 orders of magnitude.
(5) Higher accuracy. The relative error of a general light source is 5% to 10%, while the relative error of ICP can reach below 1%.
(6) The linear range of the ICP light source standard curve is wide, reaching 46 orders of magnitude, allowing for multi-element analysis of a single sample, and can measure different concentrations of high, medium, and low levels.
(7) Low sample consumption, suitable for the multi-component determination of whole batches of samples, especially qualitative analysis, shows unique advantages.
2.2 Disadvantages
The disadvantages of the ICP method are as follows.
(1) Many factors affect the intensity of the spectral lines, such as sample composition, uniformity, sample parallelism, acid concentration, spectral interference, temperature, and humidity, all of which can impact the final detection results. There are high requirements for the components of the standard reference, and most non-metallic elements have difficulty obtaining sensitive spectral lines.
(2) Solid samples generally need to be converted into a solution beforehand, which often worsens the detection limit; the accuracy is poor when the concentration is high.
(3) Not suitable for samples containing impurities such as Ir that are insoluble in aqua regia.
(4) Requires an expensive inductively coupled plasma emission spectrometer, which consumes a large amount of argon during operation, resulting in high detection costs.
3. Instruments and reagents used in the ICP method
3.1 Instruments
Instruments include: Inductively coupled plasma emission spectrometers、Beakers、Volumetric flasks and so on other common laboratory glassware, high-precision electronic balances and etc.
3.2 Reagents
The water used for ICP testing meets the specifications for first-grade water or water of equivalent purity as specified in “Specifications and Test Methods for Water Used in Analytical Laboratories” (GB/T 6682-2008).
The chemical reagents used in ICP testing can be divided into two categories: sample decomposition and preparing standard solutions of elements. All reagents are required to be of analytical grade. When analyzing gold content, a high-purity gold sample with a purity not lower than 99.999% is needed.
4. ICP Analysis Steps
As an example, the steps include the following analysis of gold content in gold jewelry.
4.1 Sample Preparation
After grinding the sample thin, Cut it into small pieces, place them in a beaker, add 20mL of ethanol solution, heat, boil for 5 minutes, then remove it. Pour off the ethanol solution, and wash the gold piece repeatedly with ultrapure water three times. Add 20mL of hydrochloric acid solution, heat, boil for 5 minutes, then remove it. Pour off the hydrochloric acid solution, and wash the gold piece repeatedly with ultrapure water three times. Place the gold piece in a glass weighing bottle, cover it, and put it in the oven to dry at 105℃, then take it out for later use.
4.2 Solution Preparation
(1) Sample Solution. Weigh (1000±2.5)mg sample (accurate to 0.01mg), place it in a 100mL beaker, add 30mL of aqua regia, cover with a watch glass, and slowly heat until completely dissolved, continuing to heat to remove nitrogen oxides. After cooling, transfer the solution to a 50mL volumetric flask, rinse the watch glass and beaker with aqua regia solution, add the wash liquid to the volumetric flask, dilute to the mark, and mix well for later use. Prepare two portions of sample solution for each sample.
(2) Calibration Solution. Weigh three portions of high-purity gold samples with a mass of (1000±2.5)mg (purity > 99.999%), dissolve them to obtain three portions of high-purity gold solution, and prepare the calibration solution according to the following steps.
Calibration Solution 1:
Transfer the first portion of the high-purity gold solution to a 50mL volumetric flask. Rinse the watch glass and beaker with aqua regia solution. Add the wash liquid to the volumetric flask, Dilute to the mark, Mix well. The concentration of the measured impurity elements in Calibration Solution 1 is set to 0/ug/m.
Calibration solution 2:
Transfer the second portion of the high-purity gold solution to a 50mL volumetric flask pre-filled with 5mL of mixed standard solution 1. Rinse the surface dish and beaker with aqua regia solution. Add the wash liquid to the volumetric flask. Dilute to the mark. Shake well.
Calibration solution 3:
Transfer the third portion of the high-purity gold solution to a 50mL volumetric flask pre-filled with 5mL of mixed standard solution 2. Rinse the surface dish and beaker with aqua regia solution. Add the wash liquid to the volumetric flask, Dilute to the mark, Shake well.
4.3 Determination
Adjust the ICP spectrometer to optimal conditions; if testing gold alloy samples, select appropriate analytical lines and background correction according to Table 6-2.
Table 6-2 Recommended wavelengths for impurity elements (analytical lines) (Unit: nm)
| Element | Wavelength | Other available wavelengths | Element | Wavelength | Other available wavelengths |
|---|---|---|---|---|---|
| Ag | 328.068 | 338.289 | Ni | 352.454 | 231.604 |
| Al | 396.152 | 308.215 | Pb | 168.220 | 220.353 |
| Jak | 189.042 | 193.696 | Pd | 340.458 | 355.308 |
| Bi | 223.061 | 306.772 | Pt | 306.471 | 203.646 |
| Cd | 226.502 | 228.802 | Rh | 343.489 | - |
| Co | 228.616 | 238.892 | Ru | 240.272 | - |
| Cr | 267.716 | 283.563 | Sb | 206.833 | 217.581 |
| Cu | 324.754 | 327.396 | Se | 196.090 | - |
| Fe | 259.940 | 239.563 | Sn | 189.989 | 189.927 |
| Ir | 215.278 | - | Te | 214.281 | - |
| Mg | 279.553 | 280.270 | Ti | 334.941 | - |
| Mn | 257.610 | 260.569 | Zn | 213. 856 | - |
Measure the impurity element spectral line intensity of calibration solution 1,3, where the concentration of the measured impurity elements in calibration solution one is set to 0/ug/mL, and plot the working curve based on the test results; under the same conditions as the measurement calibration solution, measure the spectral line intensity of impurity elements in two sample solutions and obtain the concentration of each impurity element in the sample solution from the working curve.
4.4 Result Representation
(1) Calculation of the total amount of impurity elements. The total amount of impurity elements in the sample is calculated according to formula (6-4):
W formule:
ƩA – total amount of impurity elements in the sample (‰);
ƩCi – total concentration of impurity elements in the sample solution ug/mL);
V – volume of the sample solution (mL);
m – Mass of the sample (mg).
(2) Calculation of gold content.
The gold content in the sample is calculated according to formula(6-5):

W formule:
w(Au) – gold content in the sample (‰);
ƩA – Total amount of impurity elements in the sample (‰).
(3) Reproducibility. The relative deviation of the total impurity elements in two parallel determinations of the samples should be less than 20%; if exceeded, re-determination is required.
5. Factors of Interference in ICP Analysis
During the ICP detection process, interference phenomena are inevitably present, as shown in Figure 6-16. Based on the interference mechanism, it can be divided into two main categories: spectral interference and non-spectral interference. In contrast, according to the state of the interfering factors, it can be divided into gas-phase interference and condensed-phase interference.
Spectral interference and non-spectral interference are effects caused by the components of the sample matrix and accompanying substances, which enhance or weaken the already resolved analytical signals. Non-spectral interference includes sample preparation, spray, solvent removal, volatilization, atomization, excitation, and ionization interference, as shown in Figure 6-16.
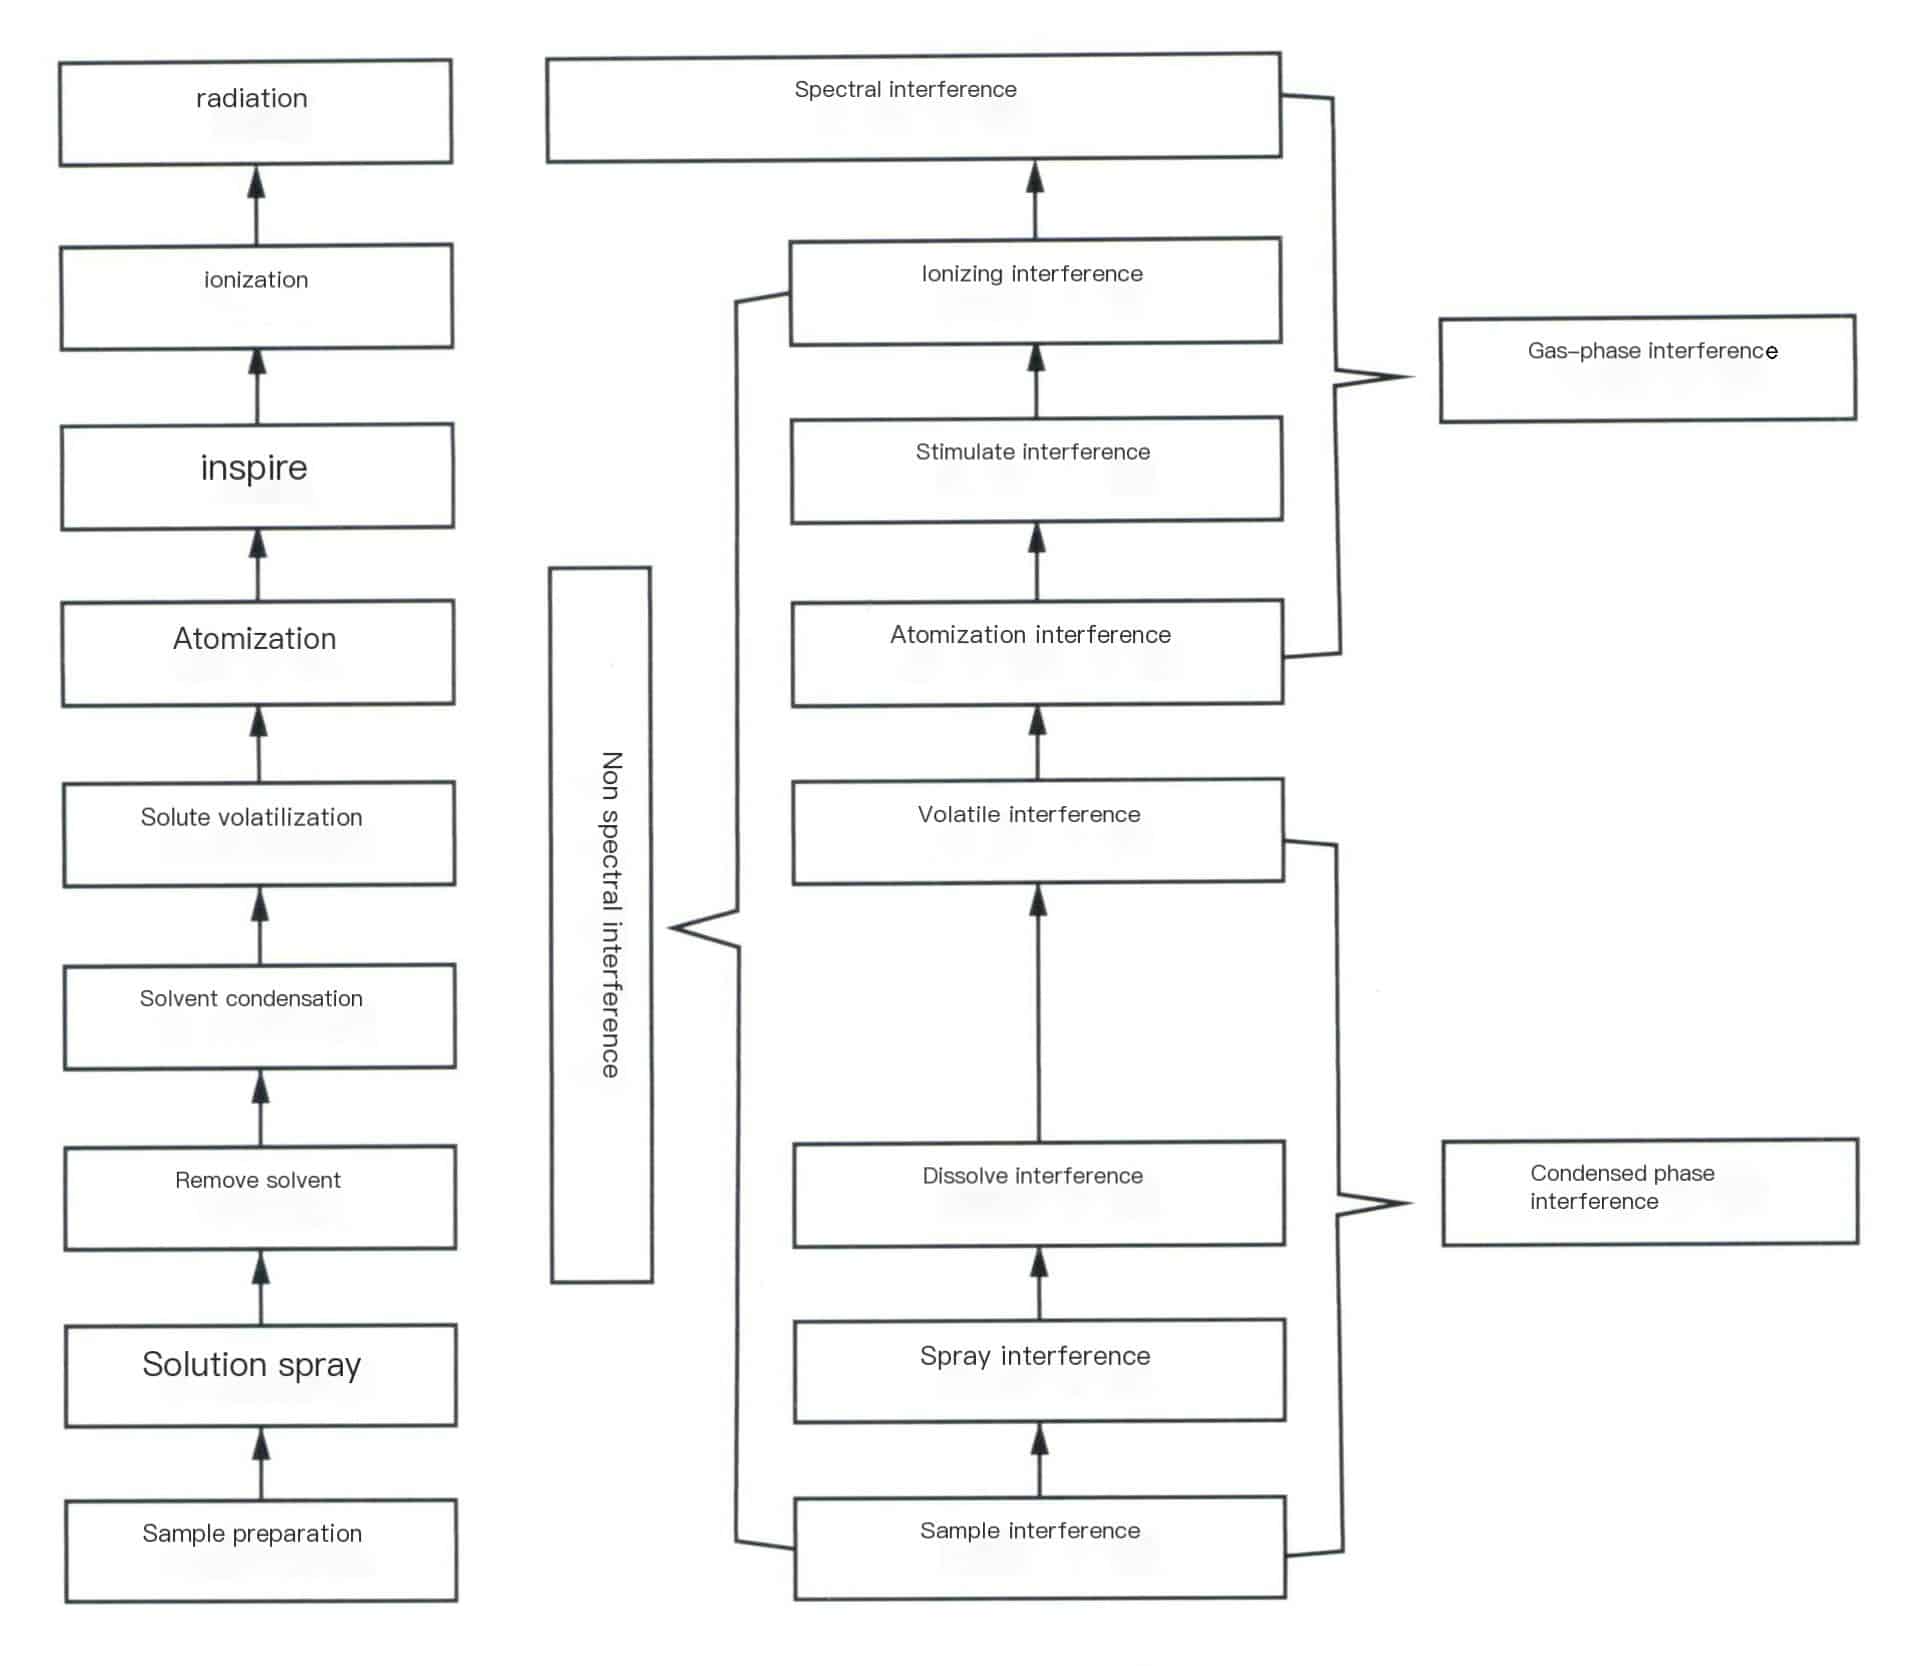
5.1 Spectral Interference
Spectral interference is caused by the inability to resolve the radiation signals generated by the analyte signals and interfering substances. It is the most important and troublesome issue in ICP spectrometry. Due to the strong excitation capability of ICP, almost every substance present in or introduced into ICP emits a considerable number of spectral lines, resulting in a large amount of spectral “interference.”
Spectral interference is mainly divided into two categories: one is line overlap interference, which is caused by the insufficient dispersion and resolution of the spectrometer, leading to the overlap of spectral lines of certain coexisting elements in the analysis; the other is background interference, which is related to the influence of the matrix composition and the strong stray light emitted by the ICP light source itself. Using a high-resolution spectroscopic system for line overlap interference does not mean that this type of spectral interference can be eliminated; it can only be considered that when spectral interference occurs, it can be reduced to minimum intensity. Therefore, the most commonly used method is to select another spectral line with less interference as the analytical line or to apply interference factor correction (IEC) for correction. The most effective method for background interference is to utilize the background correction technology available in modern instruments to deduct it. When interference occurs, they can be reduced to a minimum intensity. Therefore, the most commonly used method is to select another spectral line with less interference as the analytical line or to apply interference factor correction (IEC) for correction. The most effective method for background interference is to utilize the background correction technology available in modern instruments to deduct it.
5.2 Non-spectral interference
(1) Interference from physical factors.
Since the samples for ICP spectral analysis are in solution form, factors such as the viscosity, relative density, and surface tension of the solution all affect the atomization process, droplet size, aerosol transport, and solvent evaporation, and viscosity is related to the composition of the solution, the concentration and type of acid, and temperature.
When the solution contains organic solvents, both dynamic viscosity and surface tension will decrease, improving atomization efficiency. At the same time, most organic reagents are flammable, thus increasing the tail flame’s temperature and increasing spectral line intensity. At this time, the power of the ICP needs to be appropriately increased to suppress the intensity of the molecular spectrum of carbides in the organic reagents.
As seen above, the interference of physical factors exists and should be avoided. The main method is to ensure that the standard test solution and the sample to be tested are completely consistent regarding the composition of matrix elements, total salinity, concentration of organic solvents, and acids. Currently, the peristaltic pump sampling system used can help reduce the aforementioned physical interference. Additionally, internal standard correction can appropriately compensate for the effects of physical interference. Matrix matching or standard addition methods can effectively eliminate physical interference but require a larger workload.
(2) Ionization interference.
Since the sample in the ICP is evaporated, dissociated, ionized, and excited in the channel, the changes in sample composition have little effect on the electrical parameters of the high-frequency skin effect. Therefore, the influence of easily ionizable elements on the intensity of ion lines and atomic lines is smaller than that of other light sources. However, experiments show that this easily ionizable interference effect still has a certain impact on spectral analysis.
For vertically observed ICP light sources, appropriately selecting the plasma parameters can minimize ionization interference.
However, for horizontally observed ICP light sources, this easily ionizable interference is relatively more severe. The currently used bidirectional observation technology can effectively address this easily ionizable interference. It is also necessary to maintain a similar composition between the sample solution to be tested and the analytical standard solution.
(3) Matrix effect interference.
The matrix effect originates from the plasma, and for any analytical line, this effect is related to the excitation potential of the spectral line. However, due to the good detection capability of ICP, the analytical solution can be appropriately diluted to keep the total salt content around 1mg/mL. In this diluted solution, matrix interference is often negligible. When the concentration of the matrix substance reaches several milligrams per milliliter, the matrix effect cannot be completely ignored. The matrix effect of the ICP light source is slightly more severe when observed horizontally. Matrix matching, separation techniques, or standard addition methods can eliminate or suppress the matrix effect.
Copywrite @ Sobling.Jewelry - Producent biżuterii na zamówienie, fabryka biżuterii OEM i ODM