


Utforsk nøyaktige metoder for å teste renheten til smykker av edelmetall
En guide til testing av edelmetallinnhold i smykker

Innholdsfortegnelse
Seksjon ⅠPrinsipper for testing av renheten til smykker av edelmetall
Å teste renheten til smykker av edelt metall har eksistert siden oldtiden. Våre forfedre stolte først og fremst på sine sanseinntrykk og eksisterende erfaringer for å utføre tester for å bestemme renheten til edelmetallsmykker. De observerte for eksempel fargen med øynene, veide det med hendene og testet hardheten ved å bite på det. Det er selvfølgelig også en spesifikk vitenskapelig begrunnelse bak dette. Imidlertid, med utviklingen av vitenskap og teknologi, har den kontinuerlige oppfinnelsen og oppdateringen av vitenskapelige testinstrumenter introdusert noen moderne vitenskapelige testverktøy i renhetstesting av edelmetallsmykker, spesielt i kommersiell testing.
Moderne testteknologi for renhet av edelmetallsmykker er basert på vitenskapelige instrumenter som kjennetegnes av nøyaktighet, kort testtid, lave kostnader og enkel betjening. Utviklingen går mot raskere, enklere og mer nøyaktige metoder. Med den kontinuerlige utviklingen av vitenskap og teknologi vil testteknikkene og metodene for renhet av edelmetallsmykker bli mer raffinerte.
Når man tester renheten til smykker av edelt metall, må man generelt følge følgende tre prinsipper.
(1) Ikke-destruktiv testing bør oppnås i så stor grad som mulig. Når man velger testmetoder, bør man derfor velge metoder som ikke skader edelmetallsmykkets utseende. Hvis det virkelig er uunngåelig, må man innhente samtykke eller autorisasjon fra kunden.
(2) Deteksjonen skal opprettholde et visst nivå av nøyaktighet. Deteksjonsnøyaktigheten skal med andre ord ligge innenfor det tilsvarende standardområdet.
(3) Deteksjonskostnadene bør være så lave som mulig.
De spesifikke målene for å oppdage kvaliteten på smykker av edelt metall inkluderer hovedsakelig to aspekter: det første er å identifisere ektheten til smykker av edelt metall; det andre er å bestemme kvaliteten på smykker av edelt metall.
Del II Vanlige, enkle deteksjonsmetoder for kvalitet på edelmetallsmykker
Siden oldtiden har mennesker utforsket et komplett sett av erfaringsbaserte metoder for å identifisere kvaliteten og ektheten til edle metaller basert på deres egenskaper. Ved å bruke disse metodene på riktig måte kan man effektivt, raskt og kvalitativt identifisere ektheten og kvaliteten på edelmetallsmykker.
1. Observere farge-metoden
Gamle mennesker anerkjente at det er en viss korrespondanse mellom fargen på gull og dets innhold. Det er et ordtak i folklore: "Fire syvere er ikke gull." "Syv grønn" refererer til et gullinnhold på 70% og et sølvinnhold på 30%, der gullet fremstår som grønngult; "Åtte gul" refererer til et gullinnhold på 80% og et sølvinnhold på 20%, der gullet fremstår som gullgult; "Ni lilla" refererer til gullinnhold 90% og sølvinnhold 10%, der gullet fremstår som purpur-gult; "Ti rød" refererer til gullinnhold nær 100% og ekstremt lavt sølvinnhold, som er rødt gull, fingull eller rent gull, der gullet fremstår som rødgult. Denne tradisjonelle metoden for å oppsummere erfaring er bare effektiv for å bedømme sølvholdig klart gull.
Det er en svak rødlig fargetone over det gyllengule for rent gull, fingull, rødt gull, rent rødt gull, 999 gull og 24K gull. Fargen som i folketroen omtales som "rødt gull" eller "fint gull", er denne fargen på rent gull. For K-gull 22 K, 18 K, 14 K, 10 K, 9 K, 8 K gjenspeiler fargen på gullsmykker typen og andelen av urenheter i gullet. Generelt sett har fargen på den sølvholdige klare gullserien en tendens til å være gul, mens fargen på den kobberholdige blandede gullserien har en tendens til å være rød.
Å bedømme kvaliteten på gull basert på den viste fargen kan bare være en kvalitativ beskrivelse. Med moderne vitenskap og teknologiutvikling kan gull av forskjellige kvaliteter vise samme farge, som vi har introdusert tidligere. Å bruke denne metoden for å bestemme kvaliteten på naturlig gull har en viss begrunnelse.
I tradisjonelle håndverkssmykker bruker falske sølvsmykker ofte aluminium eller aluminiumslegeringer, hvitt kobber, tinn eller tinnlegeringer, som vanligvis har en kjedelig grå farge og dårlig glans; smykker med lite sølv har en litt gul eller grå farge og dårlig forfining; smykker med høyt sølv er lyse, rene hvite og har bedre glans. Generelt sett, når smykkene er en legering av sølv og kobber, ser 85 sølv litt rødlig ut, 75 sølv ser rødgult ut, 60 sølv ser rødt ut og 50 sølv ser svart ut; når smykkene er en legering av sølv og hvitt kobber, ser 80 sølv gråhvit ut, og 50 sølv ser svartgrå ut; når smykkene er en legering av sølv og messing, jo lavere sølvinnhold, jo gulere er smykkefargen. Generelt har rene hvite og fint utformede smykker en kvalitet på over 90%. Til sammenligning har hvite smykker med grått og rødt og grovt håndverk en kvalitet på rundt 80%, og gråsvarte eller lys gulrøde smykker har vanligvis en kvalitet under 60%. Det bør bemerkes at moderne håndverksimitasjoner av sølv eller smykker med lavt sølvinnhold, når de er overflatebelagt med sølv eller rhodium, kan ha farger, presisjon og overflateglans som ikke kan skilles fra ekte sølvsmykker, noe som gjør det umulig å visuelt vurdere kvaliteten på smykkene.
Kvaliteten på platina og sammensetningen av legeringselementer varierer, noe som resulterer i forskjellige viste farger: Platina av høyere kvalitet presenterer en blåhvit med en litt grå farge. Platina som inneholder en viss mengde Cu eller Au, fremstår blåhvit med en svak gulfarge. Platina med en høyere mengde Ag fremstår sølvhvit. Palladiumsmykker har generelt en stålhvit farge med god metallglans. Imitasjoner av platina- eller palladiumsmykker er ofte laget av hvitt kobber, nikkellegeringer, natriumlegeringer osv. som er utsatt for oksidasjon og matthet.
2. Testmetode for prøvestein
Prøvesteinsmetoden er det eldste verktøyet og den eldste metoden for å identifisere ektheten og kvaliteten på gull og sølv, og det er dokumentert at den ble brukt i gamle sivilisasjoner over hele verden. Metoden går ut på å skrape de testede smykkene og en gullstandard (et sett gullplater med en bestemt kvalitet, kalt standarden) på prøvesteinen. Ved å sammenligne fargen på ripene som etterlates på prøvesteinen, kan man avgjøre smykkets autentisitet og kvalitet. Denne testmetoden har lenge vært ansett som en relativt nøyaktig, pålitelig og rask deteksjonsmetode. Selv i dag bruker mange gull- og sølvgjenvinningsbutikker fortsatt ofte denne metoden for å raskt identifisere materialer, noe som kan oppdage både kvaliteten på gullsmykker og kvaliteten på sølvsmykker.
Tradisjonelle berøringssteiner er for det meste svarte eller grå steiner, vanligvis laget av svart flint eller kiselholdig skifer, med en Mohs-hardhet på ca. 6,5 og en fin tekstur. Mørke kiselholdige steiner i nærheten av det gamle gull- og kobberfunnet i Xinjiang i Kina, mørke kiselholdige steiner kjent som "ørkenlakk" i Gobiørkenen og svarte regnblomststeiner fra Nanjing kan alle bearbeides til utmerkede prøvesteiner etter sliping. Gullprøveplaten er en slank liten plate laget av gull med ulike standardrenheter, gravert med standardrenheten til gullplaten i den ene enden, som har et lite hull som er boret gjennom den for inntrekking i grupper, vanligvis bestående av flere stykker, som vist i figur 6-1. Jo finere klassifiseringen av gullplaten er, desto større fargespekter dekkes, og desto mer nøyaktige blir analyseresultatene.

Den viktigste metoden for å teste renheten til gullsmykker er en kolorimetrisk metode. Metoden er som følger:
(1) Klargjør prøvesteinen.
Vask arbeidsflaten på teststeinen med vann, skyll den og blås den tørr. På steinoverflaten med ricinusolje belagt for å danne oljekanalen, lang til endene av teststeinen, er bredden på 20 mm passende, etter oljing med en ren silkeklut for å tørke av den flytende oljen slik at oljekanalen for å opprettholde et veldig tynt lag. Når oljelaget er for tykt, er det lett å rulle olje og svart, men hvis det er for tørt, er det ikke lett å farge. Kanten av oljekanalen skal være rett, flush, parallelt med kanten av teststeinen, og uten olje del av dannelsen av et klart skille for å opprettholde sliping av samme lengde av gullkanalen. Vær oppmerksom på fingrene. Ikke berør steinoverflaten; unngå overflaten farget med støv og fuktighet, spesielt i munnen gass og svette i hendene. Ellers tar det arbeid å farge.
(2) Slipemetode.
Når du bruker en slipestein til sliping, holder du vanligvis steinen med venstre hånd og gullet med høyre hånd, med tommelen på toppen og de andre fingrene under. Den oljede siden skal være på toppen, og berøringssteinen skal holdes fast i hånden og stabiliseres på bordet uten å bevege seg. Under sliping skal gjenstanden som skal testes eller testplaten presses tett mot steinoverflaten, og høyre hånd som holder gullet, skal bruke håndleddsstyrke. Slipebanen er vanligvis 20-30 mm lang og 3-5 mm bred. Gullstykkets bane og testplatebanen skal være konsistente i lengde og bredde, og testplatebanen kan slipes på begge sider av gullstykkets bane for fargesammenligning. Hvis fargen på gullstykkets bane ikke stemmer overens med testplatens bane, velger du en annen testplate å slipe og observerer fargen til de to banene stemmer overens.
(3) Identifikasjon
Når gull skrapes på berøringssteinen, etterlater det et farget merke. Gjennom lang tids praksis har folk oppsummert et sett med erfaringer for å identifisere ektheten og kvaliteten på gull ved hjelp av berøringssteinen, kjent som "se på fargen flatt, se på lyset i en vinkel, lytt nøye til lyden". Rent gull som inneholder sølv er mykt, og gullbanen ser blålig ut uten flytende farge, med hovedfokus på "å se på fargen flatt" og sekundært på "å se på den flytende fargen i en vinkel". For blandet gull som inneholder sølv og kobber, er det lyd og flytende lys under sliping, med hovedfokus på "å se på den flytende fargen i en vinkel" og sekundært på "å se på fargen flatt". Ved å bruke syre til å erodere gullbanen kan man forsterke fargeforskjeller og fremheve karakteristiske trekk. Syren som brukes, bør fortrinnsvis reagere med uedle metaller og sølv i edelmetallmaterialene. Avhengig av legeringens kvalitet kan man bruke salpetersyre, en blanding av salpetersyre og salt eller en blanding av salpetersyre og saltsyre osv.
Prøvemetoden for å teste kvaliteten på gullsmykker bestemmes ved visuell observasjon og sammenligning, noe som krever rik praktisk erfaring og påvirkes av mange menneskelige faktorer, noe som resulterer i begrenset nøyaktighet. I tillegg blir det vanskelig å skille mellom gullbelagte og gullbelagte gjenstander etter hvert som det blir flere typer gullsmykker og mer komplekse sammensetninger, og med et begrenset antall gullbrorskort. Med den kontinuerlige utviklingen av ikke-destruktiv testteknologi for gull, har berøringssteinmetoden gradvis blitt erstattet av andre mer praktiske, enkle og presise metoder.
3. Veiemetode
Gull har høy tetthet, og rent gull har en tetthet på 19,32 g/cm3 tetthet. Når man veier det for hånd, føles det tungt og har en merkbar tyngdefornemmelse. Siden tettheten til gull er mye større enn for metaller som bly, sølv, kobber, tinn, jern og sink, er det ikke likegyldig om det er messing (med en tetthet på 8,9 g/cm3), kobberbaserte legeringer eller gullimitasjoner som sjeldent gull, undergull, gullimitasjoner osv., eller gullbelagte gjenstander, gullbelagte gjenstander som gull og gullfylte smykker har ikke den tunge følelsen av rent gull når de veies for hånd. Veiemetoden er mest effektiv for å skille mellom 24K gull. Den kan likevel være mer effektiv for å identifisere gullbelagte eller gullfylte produkter laget av wolframlegering, som har en tetthet som ligner på gull, fordi det er vanskelig å føle forskjellen mellom de to for hånd.
Tettheten til platina er 21,45 g/cm3og massen av samme volum platina er mer enn dobbelt så stor som massen av sølv (med en tetthet på 10,49 g/cm3). Det er også tettere enn gull, noe som gjør det tungt når det veies for hånd. Derfor er det et ordtak som sier at når man bruker veiemetoden for å skille mellom platina-, gull- og sølvsmykker: "Den tunge er platina eller gull, den lette er sølv eller messing."
Siden det også er en betydelig forskjell i tetthet mellom sølv og aluminium og rustfritt stål, kan veiemetoden også brukes til å skille dem, og si: "Aluminium er lett, sølv er tungt, kobber- og stålprodukter er verken lette eller tunge."
4. Duktilitetsmetoden
Hvor lett det er å bøye smykker kan også indirekte indikere gullsmykkets renhet og typen av edelmetallmateriale. Rent gull har utmerket fleksibilitet, en omfattende manifestasjon av gullets høye seighet og lave hardhet. Sølv er neste, platina er hardere enn sølv, og kobber har den høyeste hardheten. Gull-sølv-legeringer er litt hardere, og gull-kobber-legeringer er enda hardere; jo lavere gullinnhold i legeringen, desto høyere hardhet. Smykker i rent gull føles for eksempel veldig myke når de bøyes forsiktig ved åpningen eller låsen, mens imitasjoner av gull ikke har denne følelsen. Derfor er rent gull lett å bøye og knekke, mens gullsmykker med lavere renhetsgrad ikke er lette å bøye og er utsatt for brudd.
Når du bruker denne metoden til å teste gull- og sølvsmykker, bør du være spesielt oppmerksom på hvordan smykkets bredde og tykkelse påvirker fleksibiliteten. Generelt sett føles bredere og tykkere smykker hardere når de bøyes, mens smalere og tynnere smykker føles mykere.
5. Metode for hardhetstest
Hardheten til smykker av edelt metall er nært knyttet til gullinnholdet; jo høyere renhet, desto lavere hardhet. Rent gull har svært lav hardhet, og en vanlig metode er å bite i det med tennene. Siden tenners hardhet er større enn gull, kan det oppstå bitemerker på gull, noe som indikerer at det er gull med høy renhet. Imitasjoner av gull har derimot en høyere hardhet, noe som gjør det vanskelig å lage bitemerker. Under testingen brukes vanligvis en hard kobbernål til å skrape forsiktig på baksiden eller et lite iøynefallende område av smykket. Jo dypere riper som etterlates, desto høyere er gullinnholdet, og omvendt hvis ripen ikke er åpenbar eller grunn. Det er viktig å merke seg at bruk av denne metoden for å teste renheten til edelmetallsmykker i kommersiell testing anses som destruktiv testing og bør gjøres med samtykke eller autorisasjon fra kunden.
Rent sølv har også lav hardhet og kan ripes opp med en fingernegl. Hvis smykket er mykt og ikke hardt, kan det inneholde tinn eller bly; hvis det er hardt og ikke hardt, kan det være laget av kobber (nysølv), jern eller andre legeringer.
6. Metode for branntest
Som ordtaket sier: "Ekte gull frykter ikke ild", og "Intens ild avslører ekte gull". Gull har et høyt smeltepunkt (1063 °C) og kan forbli usmeltet, uoksidert og uforandret i fargen ved høye temperaturer (under smeltepunktet). Selv om temperaturen overstiger smeltepunktet og gullet begynner å smelte, beholder det fortsatt fargen sin. Derimot vil lavkarat gull og imitasjoner av gull endre farge, og til og med bli svarte, når de brennes rødglødende og avkjøles.
Smeltepunktet til platina (1773 °C) er høyere enn for gull. Etter å ha blitt brent og avkjølt forblir fargen uendret, mens sølv blir melkehvitt, rødlig eller svartrødt etter å ha blitt brent og avkjølt, avhengig av sølvinnholdet.
7. Metoden for å lytte til lyd og tone
På grunn av den lave hardheten til gull, sølv og platina, er lyden når smykker av massivt gull eller høykarat gull kastes opp i luften kjedelig, uten støy eller sprett. Når smykkene faller på et hardt sementgulv, vil høykarat gull- eller platinasmykker avgi en matt lyd med liten elastisitet, mens smykker av lavere karat, kobber eller rustfritt stål vil avgi en skarp og høy lyd med stor sprett. Tradisjonelt rent gull har lyd, men ingen tone og lite sprett, mens blandet gull har lyd, tone og sprett, med større sprett og skarpere, lengre toner som indikerer lavere renhet. Men med fremskritt innen produksjonsteknologi for gullsmykker har det dukket opp mange herdede gullprodukter med høy styrke i det nåværende markedet, som oppfyller standardene for 999 gull og har god elastisitet.
Platina har høyere tetthet enn gull, og platina har samme lydegenskaper som gull når det kastes opp i luften og faller til bakken, noe som kan brukes til å skille mellom imitasjoner av platina, platinabelagte og platinabelagte smykker.
På samme måte har sterlingsølv og smykker av høyrent sølv en høy tetthet og myk tekstur, noe som resulterer i en lav rebound-høyde når de slippes på en overflate. I motsetning til dette har smykker av uekte sølv eller lavrenhetssølv en relativt høyere rebound-høyde på grunn av sin lave tetthet og hardhet.
8. Merkingsmetoden
Gullsmykker må stemples i henhold til internasjonale standarder for å angi renheten. I vårt land er 24K gull merket med "rent", "fint gull", "rødt gull" eller "24K", og 18K gull er merket med blant annet "18K" eller "750".
I vårt land representeres sølvets renhet med en tusendel, prosent eller brøkdel etterfulgt av tegnet "s" (sølv), for eksempel "800s", "80s" og "80% S", som alle indikerer en sølvrenhet på 80%; internasjonalt representeres det vanligvis med en tusendel etterfulgt av "S" eller "Silver", for eksempel "800 S" og "800 Silver", som begge indikerer en sølvrenhet på 80%. Det finnes også et segl av sølvbelagt materiale, som internasjonalt vanligvis representeres med "SF" (de første bokstavene i sølvfyll).
Internasjonalt angis platinas renhet og kvalitet med et tusendelsnummer etterfulgt av "Pt", "Plat" eller "Platinum", for eksempel 950Pt som indikerer en platinarenhet på 95%; i USA er det kun merket med "Pt" eller "Plat", som garanterer at platinarenheten er over 95%.
Seksjon III Hydrostatisk metode (tetthetsmetoden)
1. Deteksjonsprinsipp
Tettheten til rent gull er 19,32 g/cm3. Hvis tettheten til et bestemt edelmetallsmykke måles til å være lavere enn denne verdien, kan det bekreftes at andre metaller er blandet inn. Størrelsen på tettheten er nært knyttet til renheten av gull. Renheten av gull kan utledes av tettheten, som er det grunnleggende prinsippet om å bruke tetthetsmetoden for å teste renheten av smykker av edelt metall.
Smykkets volum er lik summen av volumet av rent gull i smykket og volumet av de urene metallene, som er:
V = Vren + Vurenheter (6-1)
I formelen:
V-volumet til tilbehøret (ml);
Vren-Volumet av rent gull i smykket er (mL)
Vurenheter -Volumet av urenheter i smykket er (mL)
Ved å bruke en 1/10000 analysevekt for nøyaktig veiing, er m m massen til gullsmykket; ved å bruke en fin tråd for å feste smykket, måles massen i vann nøyaktig som m' (massen til tråden bør trekkes fra om nødvendig). Ifølge Arkimedes' prinsipp er oppdriftskraften som virker på en gjenstand i vann, lik massen av vannet den fortrenger, det vil si:
m - m' = V x ρ vann (6-2)
Den vanlige tettheten til vann er 1 g/cm3 , noe som resulterer i: m - m' = V, Ved å sette inn ligning (6-1) får man:
m - m' = Vren + V urenheter
I henhold til forholdet mellom objektets volum og masse V = m/ρ, følger det at

Ved å forenkle ligningen ovenfor og erstatte tettheten til rent gull med ρ rent =19,32 g/cm3 for å konvertere det til massebrøk, får vi

I formelen:
m - smykkekvalitet (g);
m' - kvaliteten på smykker i vann (g);
m ren - kvaliteten på rent gull i smykkene (g);
ρ urenheter - tettheten av urenheter i smykket (g/cm3)
2. Metoden for å ta verdien av ρ urenheter
Ovennevnte formel brukes til å oppdage innholdet av gull i gullsmykker, og den faktiske veiingen av den analytiske balansen oppnår den. Verdien av urenheter gjenstår å bestemme. I henhold til opplevelsen av gullsmykker i de viktigste urenheter for Ag og Cu, bestemmes urenhetstettheten av det relative innholdet av urenheter i Ag og Cu. Blant dem er tettheten av Ag 10,49 g / cm3og tettheten til Cu er 8,90 g/cm3, så verdien av urenheter varierer mellom 8,90 ~ 10,49/cm3. Verdiene av urenheter er som følger:
For legeringer i gull-sølv-serien (klart gull): ρ urenheter = ρ sølv = 10,49 g/cm3
For legeringer i gull-kobber-serien (blandet gull): ρ urenheter = ρ kobber = 8,90 g/cm3
For legeringer i gull-sølv-kobber-serien (blandet gull): ρ urenheter =1/(x/ρ sølv + y/ρ kobber), x+y = 1
Hvis x = y =0,5 , så er ρ urenheter =9,63 g/cm3
Hvis x:y = 1 : 2 , da er x = 0,3333, y = 0,6666, ρ urenheter = 9,375
Hvis x:y = 2 : 1 , da er x = 0,6666, y = 0,3333, ρ urenheter = 9.901
Analysen ovenfor viser at tettheten til gulllegeringen og tettheten til ulike typer og andeler av urenhetsmetaller er de viktigste faktorene for nøyaktig beregning av kvaliteten på gullsmykker. Bare når typene og andelene av urenhetsmetaller i prøven som testes er kjent på forhånd, kan kvaliteten på prøven beregnes ved hjelp av tetthetsmetoden, som også er en nødvendig forutsetning for tetthetstesting.
Det skal bemerkes at den hydrostatiske metoden kan bestemme gullinnholdet i rene gullsmykker mer nøyaktig. Alternativt, når grunnstoffforholdene mellom legeringskomponentene er kjent, kan gullinnholdet i smykket beregnes basert på den detekterte tetthetsverdien til smykket. Men når komponentforholdene i legeringen er ukjente, er det vanligvis umulig å beregne gullinnholdet i smykket basert på den detekterte tetthetsverdien. Når legeringskomponentene er usikre, er det derfor ingen én-til-én-korrespondanse mellom gullinnholdet i smykket og tetthetsverdien.
3. Kjennetegn ved deteksjon med tetthetsmetoden
Tetthetsmetoden tester tettheten til smykker ved hjelp av Arkimedes' prinsipp, og beregner kvalitetsinnholdet basert på tettheten til gull-sølv-kobber-legeringer som en funksjon av gullinnholdet. Denne metoden har fordeler som bekvemmelighet, hastighet, ikke-destruktiv prøvetaking, minimalt med utstyr og enkel betjening. Den skiller effektivt mellom ektheten til gullsmykker, for eksempel ved å avgjøre om det er gull eller gullbelagt og måle gullinnholdet i rene gullsmykker. Inspeksjonsnøyaktigheten er relativt høy for sømløse stemplede smykker, for eksempel ringer og piskekjeder. Den kan imidlertid ikke teste hule smykker. Den kan ikke skille mellom urenheter med høy tetthet, for eksempel wolfram, som har en tetthet på 19,35 g/cm3K-gull ligger svært nær rent gull, noe som gjør det vanskelig å måle med denne metoden. Feilen ved testing av kvaliteten på K-gullsmykker er betydelig, spesielt når det er sandhull og sveisehull inne i smykkene, hull på overflaten der arbeidsvæsken ikke kan trenge gjennom, eller andre urenheter enn gull og sølv, noe som kan føre til feil i deteksjonsresultatene.
4. Deteksjonsmetoder
4.1 Metode med dobbel pannebalanse
4.1.1 Testinstrumenter
En vekt med en følsomhet på 0,1 mg, nedsenkningsvæske, et lite bord og en fin kobbertråd (hår kan brukes som erstatning).
(1) Balanse. Du kan velge en mekanisk eller elektronisk vekt med en følsomhet på 0,1 mg.
(2) Nedsenkbar væske. Du kan velge vannfri etanol, karbontetraklorid, xylen, vann eller etanol blandet med vann i et 50 ml glassbeger.
(3) Lite bord. Et lite bord laget av en metallplate, i henhold til balansemodellen, kan plasseres over vektskålen uten å påvirke skålens opp- og nedbevegelse.
(4) Fin kobbertråd. Klipp flere like lange biter av fin kobbertråd (Φ = 0,2 mm), vei dem med vekten, og velg ut to segmenter fra hver gruppe med lik totalmasse, og del dem i to grupper. Rull den ene enden av de to små segmentene i den ene gruppen til små kroker og vri de andre endene sammen slik at begge de små krokene kan henge samtidig på vektskålen [Figur 6-2(a)], den ene enden kan hektes på prøveholderen, mens den andre enden senkes ned i oppløsningen [Figur 6-2(b)]; en annen gruppe kan plasseres direkte på vektskålen. Hvis du bruker hår, kan alle detaljer og behandlingstrinn for den fine kobbertråden utelates, og det kan lages en liten løkke av håret som knyttes til gullsmykket og henges på den midterste kroken på prøveholderen.

4.1.2 Betjeningstrinn
(1) Kontroller balansen mellom nullpunktene. Fjern den fine kobbertråden, bestem nullpunktet for balansen, juster skruen slik at følsomheten ikke er større enn 0,0001 g, heng deretter den fine kobbertråden på begge sider og juster nullpunktet for balansen slik at pekeren er på linje med "0"-posisjonen; hvis du bruker hår, kan dette trinnet med justering av nullpunktet for balansen etter at kobbertråden er hengt opp, utelates.
(2) Bestem temperaturkorreksjonskurven. Tettheten til nedsenkningsløsningen varierer ved ulike temperaturer. Tabell 6-1 viser tettheten til etanol, xylen og karbontetraklorid ved ulike temperaturer. I praksis kan renheten til den organiske løsningen, senere tilførsel av urenheter og temperaturforskjellen mellom termometeret og temperaturen i begeret med nedsenkningsløsningen føre til at de målte resultatene avviker fra dataene i tabell 6-1, og noen kan til og med avvike betydelig.
Tabell 6-1 Tetthet av etanol-, xylen- og karbontetraklorid-senkbare løsninger ved ulike temperaturer
| Infusjon | |||||
|---|---|---|---|---|---|
| Etanol | Etanol | Xylen | Xylen | Karbontetraklorid | Karbontetraklorid |
| Tetthet /(g/cm3) | Temperatur /℃ | Tetthet / (g/cm3) | Temperatur /℃ | Tetthet /(g/cm3) | Temperatur /℃ |
| 0.837 | 7 | 0.839 | 6 | 1.630 | 3 |
| 0.830 | 16 | 0.829 | 16 | 1.610 | 13 |
| 0.829 | 18 | 0.824 | 22 | 1.599 | 18 |
| 0.827 | 19 | 0.819 | 27 | 1.589 | 23 |
| 0.821 | 21 | 0.814 | 32 | 1.579 | 28 |
| 0.817 | 26 | 0.809 | 37 | 1.569 | 33 |
| 0.810 | 32 | 0.804 | 42 | 1.559 | 38 |
(3) Rengjør smykkene av edelmetall grundig og tørk dem av med vannfri etanol eller aceton til de er tørre.
(4) Heng gullsmykkene på den midterste kroken på veiepannen med fin kobbertråd eller hår, og vei massen av edelmetallsmykkene m.
(5) Senk edelmetallsmykkene ned i begeret med nedsenkningsvæske, og vei massen av gullsmykkene i nedsenkningsvæsken m.
(6) Beregn tettheten til smykket av edelt metall ρ gull =m/(m-m') x i forhold til tettheten til nedsenkningsvæsken.
(7) Omregne til edelmetallets finhetsgrad (gull eller sølv) basert på densitet og antatt sluttmetall.
4.1.3 Merknader
(1) Smykker av edelmetall må være rene og tørre, ellers vil feilen være betydelig.
(2) Arbeidskurven må kalibreres regelmessig; det kan ikke være en engangsforeteelse.
(3) Når edelmetallsmykker senkes ned i løsningen, må de ikke veies umiddelbart, men ristes en stund og kontrolleres visuelt for eventuelle bobler. Hvis det er noen synlige små bobler, må de fjernes.
(4) Etanol, xylen og karbontetraklorid er alle flyktige stoffer. Målingene må være raske og stabile, og vær forsiktig så du ikke søler dem på vekten. Etter målingen må du dekke til med et spesiallokk eller helle det over i en egen flaske, og ikke helle det tilbake i den opprinnelige beholderen.
(5) Hvis det oppstår en situasjon der tettheten overstiger tettheten til gull, må det utføres en kalibrering.
(6) Navn, kvalitet, form, overflatestruktur og farge på smykker av edelt metall bør registreres, spesielt farge og overflate. Strukturen er veldig viktig, da den kan forhindre avvik i kvaliteten på wolframholdige smykker. Å beholde originaldataene muliggjør analyse av deteksjonsfeil, noe som er gunstig for kvalitetsstyring.
4.2 Elektronisk balansemetode med én skål
4.2.1 Instrument
En elektronisk vekt med én skål med en følsomhet på 0,0001 g, nedsenkbar væske og opphengsstativ.
(1) Elektronisk balanse. Enkel panorering, følsomhet på 0,0001 g eller mer, digitalt display.
(2) Nedsenkbar væske. Similar to the double pan method, since there is no balance hanger, a slightly larger beaker can be used for holding.
(3) Suspension frame. It can be made larger, fixed outside the weighing pan without affecting the up and down movement of the weighing pan, with a height that is 1.5 ~ 2 times that of the immersion liquid beaker; it is also possible to weigh in the air by placing it on the weighing pan, holding it by hand in the immersion liquid, or making a hook on the balance cover to hang the sample on the balance cover.
4.2.2 Operating steps
(1) Check the balance zero point; refer to the electronic balance user manual for inspection.
(2) Determine the temperature correction curve using the double pan method.
(3) Wash and dry precious metal jewelry using the double pan method.
(4) Place the immersion liquid beaker on the weighing pan, install the suspension frame, pour in the immersion liquid, and adjust the balance to zero.
(5) Place the precious metal jewelry on the weighing pan, read the mass of the precious metal jewelry m, and record it.
(6) Hang the precious metal jewelry on the suspension frame with hair, immerse it in the immersion liquid, directly read the mass difference of the precious metal jewelry in air and the immersion liquid (m-m’), and record it.
(7) Calculate the density of precious metal jewelry using the double pan method.
(8) Convert the fineness of precious metal jewelry using the double pan method.
4.2.3 Notes
(1) The single pan method does not have a table pad, and the volatility of the immersion liquid significantly affects accuracy. Therefore, the time between zeroing and measuring the mass must be short, and measurements should be quick and stable, especially in summer, when the time interval between two measurements should be minimized.
(2) The sample pan must be centered, and the immersion liquid beaker should be placed in the center; otherwise, it will affect the measurement results.
(3) The sensitivity of the electronic balance must be checked, and the digital display system should also be verified with known standards.
(4) Be careful when pouring the liquid, and do not spill it on the surface of the electronic balance.
Section IV X-ray Fluorescence Analysis Method (XRF Method)
X-ray fluorescence spectroscopy (XRF) is an effective analytical method widely used in metallurgy, mining, petroleum, environmental protection, medicine, geology, archaeology, criminal investigation, grain and oil, finance, and other sectors. The X-ray fluorescence spectroscopy method for precious metals is one of the testing methods recommended by international financial organizations.
1. Basic Principles of X-ray Fluorescence Analysis
The electron probe determines the wavelength (or energy) and intensity of the characteristic X-ray spectral lines emitted after the sample is excited. X-ray fluorescence analysis is similar to this, but unlike the electron probe, the incident light is X-rays. The irradiated sample absorbs the primary X-rays and is excited to emit secondary X-rays. Various secondary X-rays are referred to as X-ray fluorescence, and by measuring the wavelength (or energy) and intensity of these characteristic spectral lines, the content of elements can be determined.
2. Structure of X-ray fluorescence spectrometer
In 1948, Friedman (H. Friedman) and Birks (L. S. Birks) created the world’s first commercial X-ray fluorescence spectrometer. For decades, the technology of X-ray fluorescence spectrometers has developed rapidly, with new models characterized by speed, flexibility, and precision continuously emerging. X-ray fluorescence spectrometers are divided into two main categories: wavelength-dispersive X-ray fluorescence spectrometers and energy-dispersive X-ray fluorescence spectrometers. The former can be further divided into sequential and simultaneous types.
2.1 Sequential wavelength-dispersive X-ray fluorescence spectrometer
The sequential wavelength dispersive X-ray fluorescence spectrometer mainly consists of an X-ray tube, a spectroscopic system, a detection system, and a recording system. The structure of the instrument is shown in Figure 6-3.
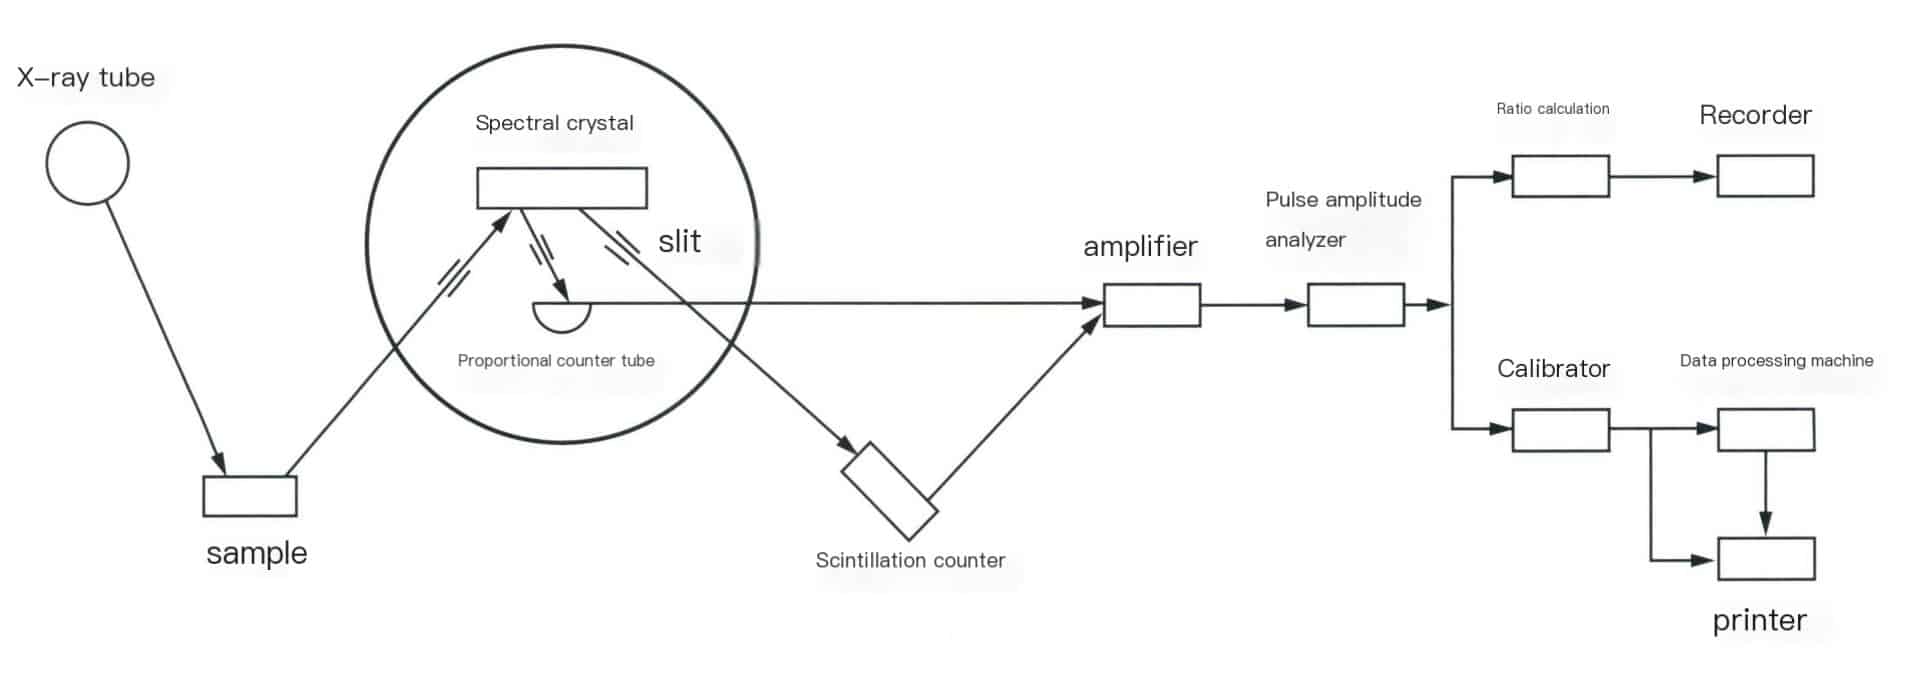
(1) X-ray tube.
The X-ray tube is the device that generates X-rays, essentially a high-voltage vacuum diode, which includes a cathode that emits electrons and an anode (target) that receives electrons. Electrons bombard the anode target surface to produce X-rays, which are emitted from the window of the X-ray tube and irradiate the sample. Lightweight element materials are selected to reduce the absorption of X-rays of various wavelengths by the window, and commonly used X-ray tubes often use beryllium windows.
(2) Spectroscopic system.
It consists of several parts, including the sample chamber, slits, and spectroscopic crystals. The sample chamber is where the samples are stored, including components such as sample trays, boxes, sample holders, and sample rotation mechanisms. The samples can be solid (blocks, plates, rods, powders, etc.) or liquid. The slit, also known as a collimator or prism grating, serves to intercept the divergent X-rays generated from the sample, converting them into parallel beams that are projected onto the spectroscopic crystal or detector window. The role of the spectroscopic crystal is to separate or disperse spectral lines of different wavelengths. The basic principle of dispersion is to utilize the diffraction phenomenon of the crystal to separate characteristic spectral lines of different wavelengths, allowing for the selection of characteristic X-rays of the measured elements for determination.
(3) Detection system.
It receives X-rays and converts them into measurable or observable signals. Signals, such as visible light, electrical pulse signals, etc., are measured through electronic circuits. Common detectors in modern X-ray fluorescence spectrometers include scintillation counters, proportional counters, and semiconductor detectors.
Scintillation counter: It is a commonly used counter with high detection efficiency for short-wave X-rays, and its detection efficiency for heavier elements can be close to that of X-rays with wavelength less than 3A. It consists of a scintillator, photomultiplier tube, high-voltage power supply, and other components in the X-ray analysis of its energy resolution for heavy elements for 25%-30% and lighter elements for 50%-60%.
Proportional counter: Divided into closed proportional counters and gas-flow proportional counters.
Proportional counters are used to detect X-rays with wavelengths greater than 3A. Modern X-ray spectrometers commonly use gas-flow proportional counters. To reduce the absorption of long-wave X-rays, the aluminum-coated polyester film used as the detector window material is very thin (commonly 6um, but there are even thinner ones). The thin window cannot prevent gas leakage, so fresh gas is introduced to expel air using gas flow. P10 gas (90% argon, 10% methane) is the most widely used mixed gas. The energy resolution of proportional counters is better than that of scintillation counters.
Closed proportional counters permanently seal ionized gases, such as inert gases, oxygen, nitrogen, etc., to prevent gas leakage and are equipped with relatively thick beryllium or mica windows, with mica window thickness usually 12-15um. Other conditions are the same as those of gas-flow proportional counters.
Semiconductor detectors: Mainly used in energy dispersive spectrometers, their advantages are high detection efficiency and energy resolution, allowing energy detection from most characteristic spectra of light and heavy elements.
(4) Recording system.
Composed of an amplifier, pulse amplitude analyzer, and readout section. Amplifier: includes a preamplifier and a linear amplifier (the main amplifier). The pulse amplitude output from scintillation counters and proportional counters generally ranges from tens to hundreds of millivolts; weak electrical signals cannot be counted directly and must be amplified. The preamplifier amplifies first, usually by ten to several tens of times, and the main amplifier further amplifies the input signal pulses, resulting in pulse amplitudes that meet the requirements of the subsequent discrimination circuit, with amplification factors reaching 500-1000 times. Pulse amplitude analyzer: its function is to select a certain range of pulse amplitudes, allowing the analysis line’s pulses to be distinguished from interference and background while suppressing interference and reducing costs to improve the sensitivity and accuracy of the analysis. The readout section comprises a calibrator, ratio meter, printer, and other components.
2.2 Simultaneous automated X-ray fluorescence spectrometer (also known as multi-channel X-ray fluorescence spectrometer)
It comprises a series of single-channel instruments, each with its own crystal, collimator, detector, amplifier, pulse height analyzer, and counting calibrator arranged radially around a common X-ray tube and sample. Most channels are fixed, meaning they analyze specific element spectral lines at an angle of 20, equipped with the best components suitable for that element’s spectral line. This type of channel is called a fixed channel. Currently, instrument models with 22 channels, 28 channels, 30 channels, etc., can be seen. Another channel type is a scanning channel; a multi-channel spectrometer has 1-3 scanning channels, which have motor-driven mechanisms for qualitative analysis with 2ϴ scanning.
Multi-channel instruments can simultaneously determine various elements in a sample, making them suitable for analyzing a large number of similar samples. However, this type of instrument has a large structure, is expensive, and its application could be more extensive.
2.3 Energy dispersive X-ray fluorescence spectrometer
The comparison between wavelength dispersive X-ray fluorescence spectrometer and energy dispersive X-ray fluorescence spectrometer only lies in the difference in separating (dispersing) the characteristic X-rays emitted from the sample. The former uses crystals for spectroscopy, while the latter commonly uses a semiconductor detector with high energy resolution and a multi-channel pulse amplitude analyzer for energy screening analysis. The structure of a modern energy-dispersive X spectrometer is shown in Figure 6-4.
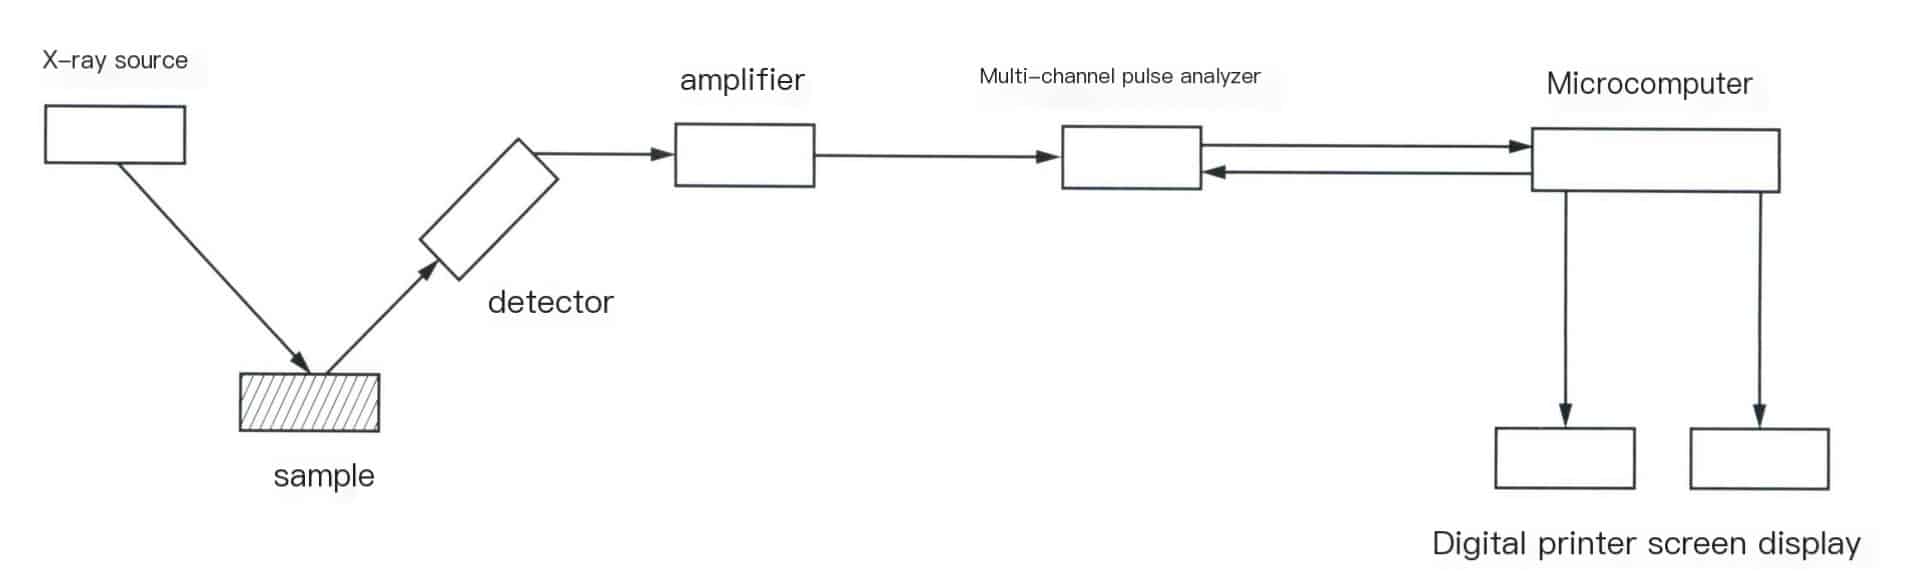
In energy-dispersive X-ray fluorescence spectrometers, the X-ray source can be an X-ray tube or a radioactive isotope as the excitation source. The characteristic X-rays emitted by the sample are sent to a semiconductor detector [commonly used Si(Li) detector] for detection, resulting in a series of current pulses proportional to the amplitude and photon energy. After amplifying the output of the detector, it is sent to a multichannel pulse height analyzer for pulse analysis. The various pulse height distributions obtained are displayed or recorded as energy spectra, where the displayed image is a spectrum of intensity versus pulse height or intensity versus photon energy. The concentration (content) of elements is determined based on the height of the energy spectrum peaks.
Since, in most cases, radioactive isotopes are used as excitation sources, this type of X-ray is also known as a “soft” XX-ray. The energy-dispersive X-ray fluorescence spectrometer made with “soft” X-rays is lightweight because it eliminates a lot of components and systems related to the X-ray source.
3. Characteristics of X-ray fluorescence spectroscopic analysis
3.1 Advantages
(1) A wide range of elements can be analyzed; almost all of the first 92 elements in the periodic table can be analyzed.
(2) The range of element content that can be analyzed is quite broad, from a few hundred thousandths to 100%, with precision comparable to other detection methods.
(3) This method is a non-destructive analytical method, meaning the sample will not be damaged during the analysis process, will not cause changes in chemical state, and will not result in sample dispersion. The same sample can be measured repeatedly, meeting the detection needs of precious metal jewelry. It is particularly suitable for the quality assessment and authenticity verification of precious metal products.
(4) The analysis speed is fast. The time required for measurement is related to the precision of the measurement, but it is generally very short, and all the elements to be measured in the sample can be completed in 2-5 minutes.
(5) It is independent of the analytical sample’s morphology and chemical bonding state; solid samples, liquids, pressed blocks, powders, films, or samples of any size can be analyzed.
(6) The analysis cost is low, and the professional background and technical proficiency required of the operators are not high.
3.2 Limitations
(1) Non-metallic elements and those between metals and non-metals are difficult to detect accurately. When testing with basic parameter methods, errors will occur if the test sample contains light elements such as C, H, or O.
(2) Representative samples are needed to create standard curves, and the accuracy of the analysis results is based on the chemical analysis of standard samples, which can easily be affected by interference from other elements and overlapping peaks. The standard curve model needs to be updated occasionally; when there are changes in the instrument or standard samples, the standard curve model must also change.
(3) There is a potential contamination threat from radioactive isotope sources.
(4) The XRF method has a large detection error for gold jewelry with different matrices, does not consider the properties and uniformity of the samples, and especially cannot make accurate detections for surface-treated gold jewelry and gold-plated items. The limitation of the density method is that if the alloy type is judged incorrectly, it can lead to significant errors or even incorrect conclusions. However, if the relative proportions of the alloy type and impurity elements are known in advance, its measurement accuracy surpasses that of other methods. Therefore, in specific applications, combining the density method and X-ray fluorescence spectroscopy is a very effective approach, where the two methods complement each other for verification: using X-ray fluorescence spectroscopy to detect the alloy type, roughly measuring the relative proportions of various impurity elements, and then using the density method to determine their content is widely applied in jewelry quality inspection stations, provided that the precious metal is a uniform alloy and not gold-plated or gold-filled.
4. Qualitative and Quantitative Analysis Methods of X-ray Fluorescence Spectrometer
4.1 Prepare the sample
Before analysis, check the sample’s variety, marks, appearance, etc.; samples with dirty surfaces should be wiped clean to ensure the measurement surface is contaminant-free.
In addition to testing institutions, jewelry companies extensively use X-ray fluorescence spectrometers to monitor the quality of materials and products during production. The samples to be analyzed can be solid or aqueous solutions, and the state of the sample affects the measurement error. Solid samples must have clean surfaces that are free of contaminants. For solid precious metal samples, attention should be paid to errors caused by component segregation. For example, due to segregation, jewelry castings made from the same gold tree but located at different positions may have different qualities. Samples with the same chemical composition but heat treatment processes will yield different counting rates. For non-uniform precious metal samples, they should be remelted to achieve uniformity, quickly cooled, and then rolled into sheets or taken from their fracture; uneven surface samples should be polished flat; for powder samples, they should be ground to 300-400 mesh and then pressed into discs, or placed in sample holders for measurement. Liquid samples can be dropped onto filter paper, and after drying the moisture with an infrared lamp, they can be measured or sealed in sample holders.
4.2 Qualitative analysis to determine the main elements and impurity components of the sample
Different elements have their specific wavelengths or energies of fluorescent X-rays, so the composition of the elements can be determined based on the wavelength or energy of the fluorescent X-rays. If it is a wavelength-dispersive spectrometer, the wavelength λ of the X-rays can be determined from the angle 2ϴ at which the detector rotates for a crystal with a certain interplanar spacing, thus determining the elemental composition. For energy-dispersive spectrometers, the energy can be identified by channels, thus determining which elements and components are present. However, manual identification is still required if the element content is too low or there is spectral line interference between elements. First, identify the target material of the X-ray tube. Measure X-ray and accompanying lines of strong peaks, then label the remaining spectral lines based on energy. When analyzing unknown spectral lines, factors such as the source and properties of the sample must be considered to make a comprehensive judgment.
4.3 Select standard samples and draw calibration curves
Based on the results of the qualitative analysis, select standard samples that match the purity level and impurity components. Generally, the following requirements apply:
(1) The types of elements in the standard sample must be similar to those in the unknown sample and should be the same.
(2) The content of all components in the standard sample must be known.
(3) The content range of the measured elements in the standard sample should include all the measured elements in the unknown sample.
(4) The state of the standard sample (such as the particle size of powder samples, the surface smoothness of solid samples, and the chemical state of the measured elements, etc.) should be consistent with the unknown sample, or it should be able to be processed to be consistent by appropriate methods.
Testing of specimens, each measured no less than three times. After repeated measurements, calculate the average value and then use the standard values of each element’s content and the corresponding average values as parameters to plot the calibration curve and derive the linear equation. Generally, laboratories should regularly verify the calibration curve.
4.4 Detect samples and calculate quantitative analysis results
The sample is tested in a sample chamber and quantitatively analyzed by X-ray fluorescence spectrometry, which is based on the fact that the fluorescence X-ray intensity of an element Ii , is directly proportional to the amount of that element in the sample Ci
Ii = Is x Ci
In the formula, Is is the fluorescence X-ray intensity of the element when Ci =100%.
According to the above formula, quantitative analysis can be performed using standard curve methods, incremental methods, internal standard methods, etc. However, these methods require that the composition of the standard sample be as similar as possible to that of the test sample; otherwise, the matrix effect of the test sample refers to the changes in the basic chemical composition and physical and chemical state of the sample, which affect the intensity of the X-ray fluorescence. Changes in chemical composition can affect the sample’s absorption of primary X-rays and X-ray fluorescence and can also alter the fluorescence enhancement effect.
Based on the calibration curve, substitute the measured values into the linear equation of the calibration curve to calculate the corrected value of the sample measurement. For each sample, select no less than three representative test values from different locations and calculate their average through repeated measurements.
5. Affecting the Detection Accuracy of the XRF Method
XRF utilizes the relationship between the fluorescent intensity of elements and their content in many standard substances with similar properties to establish a mathematical calibration curve and then determines the content by measuring the fluorescent intensity of elements in unknown samples. To obtain highly accurate detection results, establishing the standard working curve and choosing calculation methods are very important.
5.1 Standard Working Curve
Standard substances (standard samples) are the basis for establishing standard working curves. However, there currently needs to be more commercially available standard substances for precious metal jewelry in the domestic market, and the types of impurities in precious metal ornaments are diverse. It is difficult to meet the requirements for standard substances that match the impurity composition, as they rely solely on commercially available national standard substances. This leads to significant deviations in analytical results due to matrix effects. For example, in the calibration of the gold series standard substances, if there are no impurity elements like nickel, then using an X-ray fluorescence spectrometer to measure nickel-containing white K gold will inevitably result in errors.
When establishing a working curve for fitting, it is essential to reasonably select correction elements. Whether enhancement, absorption, overlap, or interference, one must consider the calculated errors after curve fitting and the actual testing deviations of standard samples to determine whether the selected elements and methods are truly effective.
The most important criterion during curve fitting is that the apparent content points on the curve should be similar to the recommended value points. The calculated correction coefficients should have positive and negative values so that the results of actual tests can be closer to their true values, making the measurement data authentic and reliable.
5.2 Selection of Calculation Methods
X-ray fluorescence spectroscopy commonly uses three quantitative analysis methods: direct method, difference method, and normalization method.
(1) Direct Method. It calculates the content of Au by substituting the intensity of Au into the corresponding intensity and content linear relationship equation.
(2) Difference Method. It obtains the content of the main element by directly subtracting the content of impurity elements from the total amount of 100%.
(3) Normalization Method. It assumes the normalized content to be 100%, sums the content values of each element, and compares it with 100%. The excess part is weighted for each element to derive the final content values of each element.
When the content of the precious metal element to be tested is greater than 75%, the linear relationship between the main element content and intensity becomes weaker, and the results obtained directly from the linear relationship tend to be inaccurate. Switching to the linear relationship of impurity elements can yield relatively accurate impurity element content. Using the normalization method or the difference subtraction method can provide more accurate main element content. When the content of precious metal elements is less than 75%, using the linear relationship between the intensity and content of Au directly for calculations yields more accurate results.
Copywrite @ Sobling.jewelry - Tilpasset smykkeprodusent, OEM og ODM smykkefabrikk
Section V Fire Assay Method (Cupellation Method)
Fire assay, also known as the cupellation method, determines the content of precious metal components in minerals and metal products through melting and roasting. Fire assay is not only an ancient means of enriching gold and silver but also an important method for gold and silver analysis. Geological, mining, and gold and silver smelting industries, both domestically and internationally, widely apply it as the most reliable analytical method in production.
Fire assay is internationally recognized as the most accurate method. Several countries have designated it as a national standard, and it has become the internationally designated arbitration method for determining gold content. China’s standard “Regulations and Naming Methods for the Purity of Precious Metals in Jewelry” (GB 11887-2012) also designates fire assay as the arbitration method for measuring gold content in gold alloys.
1. Principle of Fire Assay Method
Weigh a certain mass of the gold sample to be analyzed, add an appropriate amount of silver, wrap it in lead foil, and melt it at a high temperature. The molten lead can capture gold, silver, and precious metals, completely dissolving the exposed gold and silver in the molten state. The lead in the molten alloy is easily oxidized in air or oxygen, forming molten lead oxide. The surface tension and relative density of lead oxide differ from molten lead, causing the molten lead to sink to the bottom and form a lead button. At the same time, the porous ash dish absorbs the molten lead oxide due to its wetting properties and capillary action. The cohesive force of molten lead is strong and is not absorbed by the ash dish. After the molten lead oxide seeps into the ash dish, the molten lead exposes a new surface and is oxidized again, and the ash dish absorbs the newly formed molten lead oxide. This process continues repeatedly until all the lead is oxidized into lead oxide and absorbed by the ash dish, achieving good separation of the lead button and the slag. During this process, other base metal elements may also partially or completely form volatile oxides or be absorbed by the ash dish, achieving the goal of removing impurity elements and obtaining purer precious metal particles. After the ash blowing, the alloy particles are treated using the property that silver dissolves in nitric acid while gold does not, dissolving the silver in nitric acid and separating the gold. The gold content of the sample is calculated after weighing the gold separated from nitric acid and correcting it with a pure gold standard sample measured simultaneously.
2. Advantages and Disadvantages of Fire Assay
2.1 Advantages
(1) The fire assay method has a wide range of applications and can be used to determine the gold content in various gold and K gold jewelry with gold content between 333.0% and 999.5%. It is recognized as a classic testing method in jewelry industry testing institutions.
(2) The analysis results are reliable, with high precision and accuracy.
(3) The sample size is large and representative, which can significantly reduce sampling errors.
2.2 Disadvantages
(1) It is a destructive method requiring the destruction of samples for testing, resulting in high detection costs.
(2) It is not suitable for samples of high-purity gold jewelry (gold content above 999.5%) and samples containing impurities that are insoluble in nitric acid (such as Ir, Pt, Rh, etc.).
(3) The ash fusion process requires using the harmful element Pb as a collector, posing safety risks to the health of inspectors and the environment.
(4) The analysis process is lengthy, with many experimental steps and complex operations, requiring a high level of professional skills and experience from the experimental personnel.
3. Equipment and utensils used in the fire assay method
3.1 Ash Blowout Furnace
The high-temperature Ash Blowout Furnace is used for fire assay (a muffle furnace). The muffle furnace specifically designed for ash blowing should have air intake and exhaust ports to allow for air circulation, preferably capable of preheating the air and ensuring stable passage, as shown in Figure 6-5, with the furnace temperature able to be evenly heated from room temperature to 1100℃.

3.2 Analytical Balance
The fire assay method is a quality analysis method that has strict requirements for the analytical balance, generally requiring a sensitivity of precision analytical balance within 0.01mg. The balance and weights must be calibrated regularly, with calibration cycles ideally set to 1 month or one quarter, depending on the workload.
3.3 Gold Separation Basket
The materials used to make gold separation baskets vary by country. In China, assay laboratories often use platinum or stainless steel plates, as shown in Figure 6-6.

3.4 Rolling Mill
Used to compress the alloy into thin sheets, requiring the thickness of the rolled sheets to be uniform and consistent to avoid increasing analytical errors.
3.5 Ash Dish
The ash dish is a porous refractory vessel that absorbs lead oxide during the lead-blowing process. Common ash dishes include cement ash dishes, bone ash cement ash dishes, and magnesia ash dishes (Figure 6-7).

4. Analysis Steps of Fire Assay
Taking gold alloy jewelry with gold content between 333.0% and 999.5% as an example, the process of analyzing its gold content is mainly divided into eight steps: pre-analysis, weighing, silver replenishment, lead cladding, ash blowing, rolling, gold separation and calculation of results.
4.1 Pre-analysis
Common pre-analysis methods include the weight method and X-ray fluorescence spectroscopy (XRF). The weight method has higher accuracy for pre-analysis but takes longer. The XRF method is fast and can simultaneously analyze the impurity element content in the sample, but it has a larger margin of error. For general samples, XRF can be used for pre-analysis to understand the basic composition of the sample, facilitating the calculation of the quality of standard samples of silver, copper, nickel, etc. For irregular shapes or samples with larger XRF analysis errors, the weight method can be used for pre-analysis.
4.2 Weighing
Weigh 200-300mg standard gold samples in three or four portions and three or four portions of test samples equivalent to the standard gold quality, accurate to 0.01mg. The samples should be cut into small pieces, mixed evenly, and weighed to make the weighing more representative. The weighing of standard gold and samples should follow the principle of consistency, with the component ratios as similar as possible. The weighing deviation between parallel standard gold and parallel samples should be controlled within 2%.
4.3 Silver replenishment
When supplementing silver, the ratio of silver to gold is crucial. If silver is less than twice the amount of gold, the gold separation cannot proceed. A large ratio of gold to silver can easily cause the gold roll to break. It is more appropriate for the amount of silver to be 2.1-2.5 times that of gold. The extremely poor silver amount should be controlled within 1%. Considering the total amount of base metals contained in the sample, an appropriate amount of copper should be added proportionally to the standard gold.
4.4 Lead cladding
Wrap the weighed standard gold and sample separately in lead foil, roll them up, and number them. The weight of the lead foil is generally 3.5g, and the lead packaging amount for the standard gold and sample should be as consistent as possible. The amount of lead is proportional to the impurity content of the sample; if the copper and nickel content is high, the amount of lead can be increased. The lead and sample should be tightly wrapped to minimize gaps, avoiding splashing losses caused by air expansion after the lead is placed, as shown in Figure 6-8.

Note: The numbers in the figure are sample numbers; the same applies below
4.5 Ash blowing
Place the standard gold wrapped in lead foil and the sample into the ash-blowing furnace, arranging the standard gold and sample in a cross pattern to avoid temperature discrepancies. The crucible should be preheated to above 920℃ to prevent residual organic matter and other volatiles from causing splattering. Maintain the furnace temperature at 920-1000℃, and continue heating in an oxidizing atmosphere until the sample completely melts, for about 25 minutes. If using a closed ash-blowing furnace, after maintaining it at 920-1000℃ for 30-40 min, slightly open the furnace door for oxidizing ash blowing, and close it after 10-15 min.
After ash blowing is complete, stop heating and allow the furnace to cool down to below 700℃ before removing it, as shown in Figure 6-9, to avoid rapid cooling that could cause rapid oxidation of the agglomerates, leading to splattering and spiking.

4.6 Rolling
Use a brush to remove the ash materials adhered to the alloy particles, flatten them on an anvil (Figure 6-10), and then anneal at 700℃. Use a rolling mill to roll the alloy particles into thin sheets of 0.15-0.2 mm (Figure 6-11), and then anneal again, avoiding excessive time. The direction in which the alloy particles are fed during rolling should be consistent to prevent sample cracking and loss. The thickness of the rolled sheets should be uniform to ensure consistency in value addition. Use a digital steel stamp to mark and roll into a cylindrical shape (Figure 6-12).
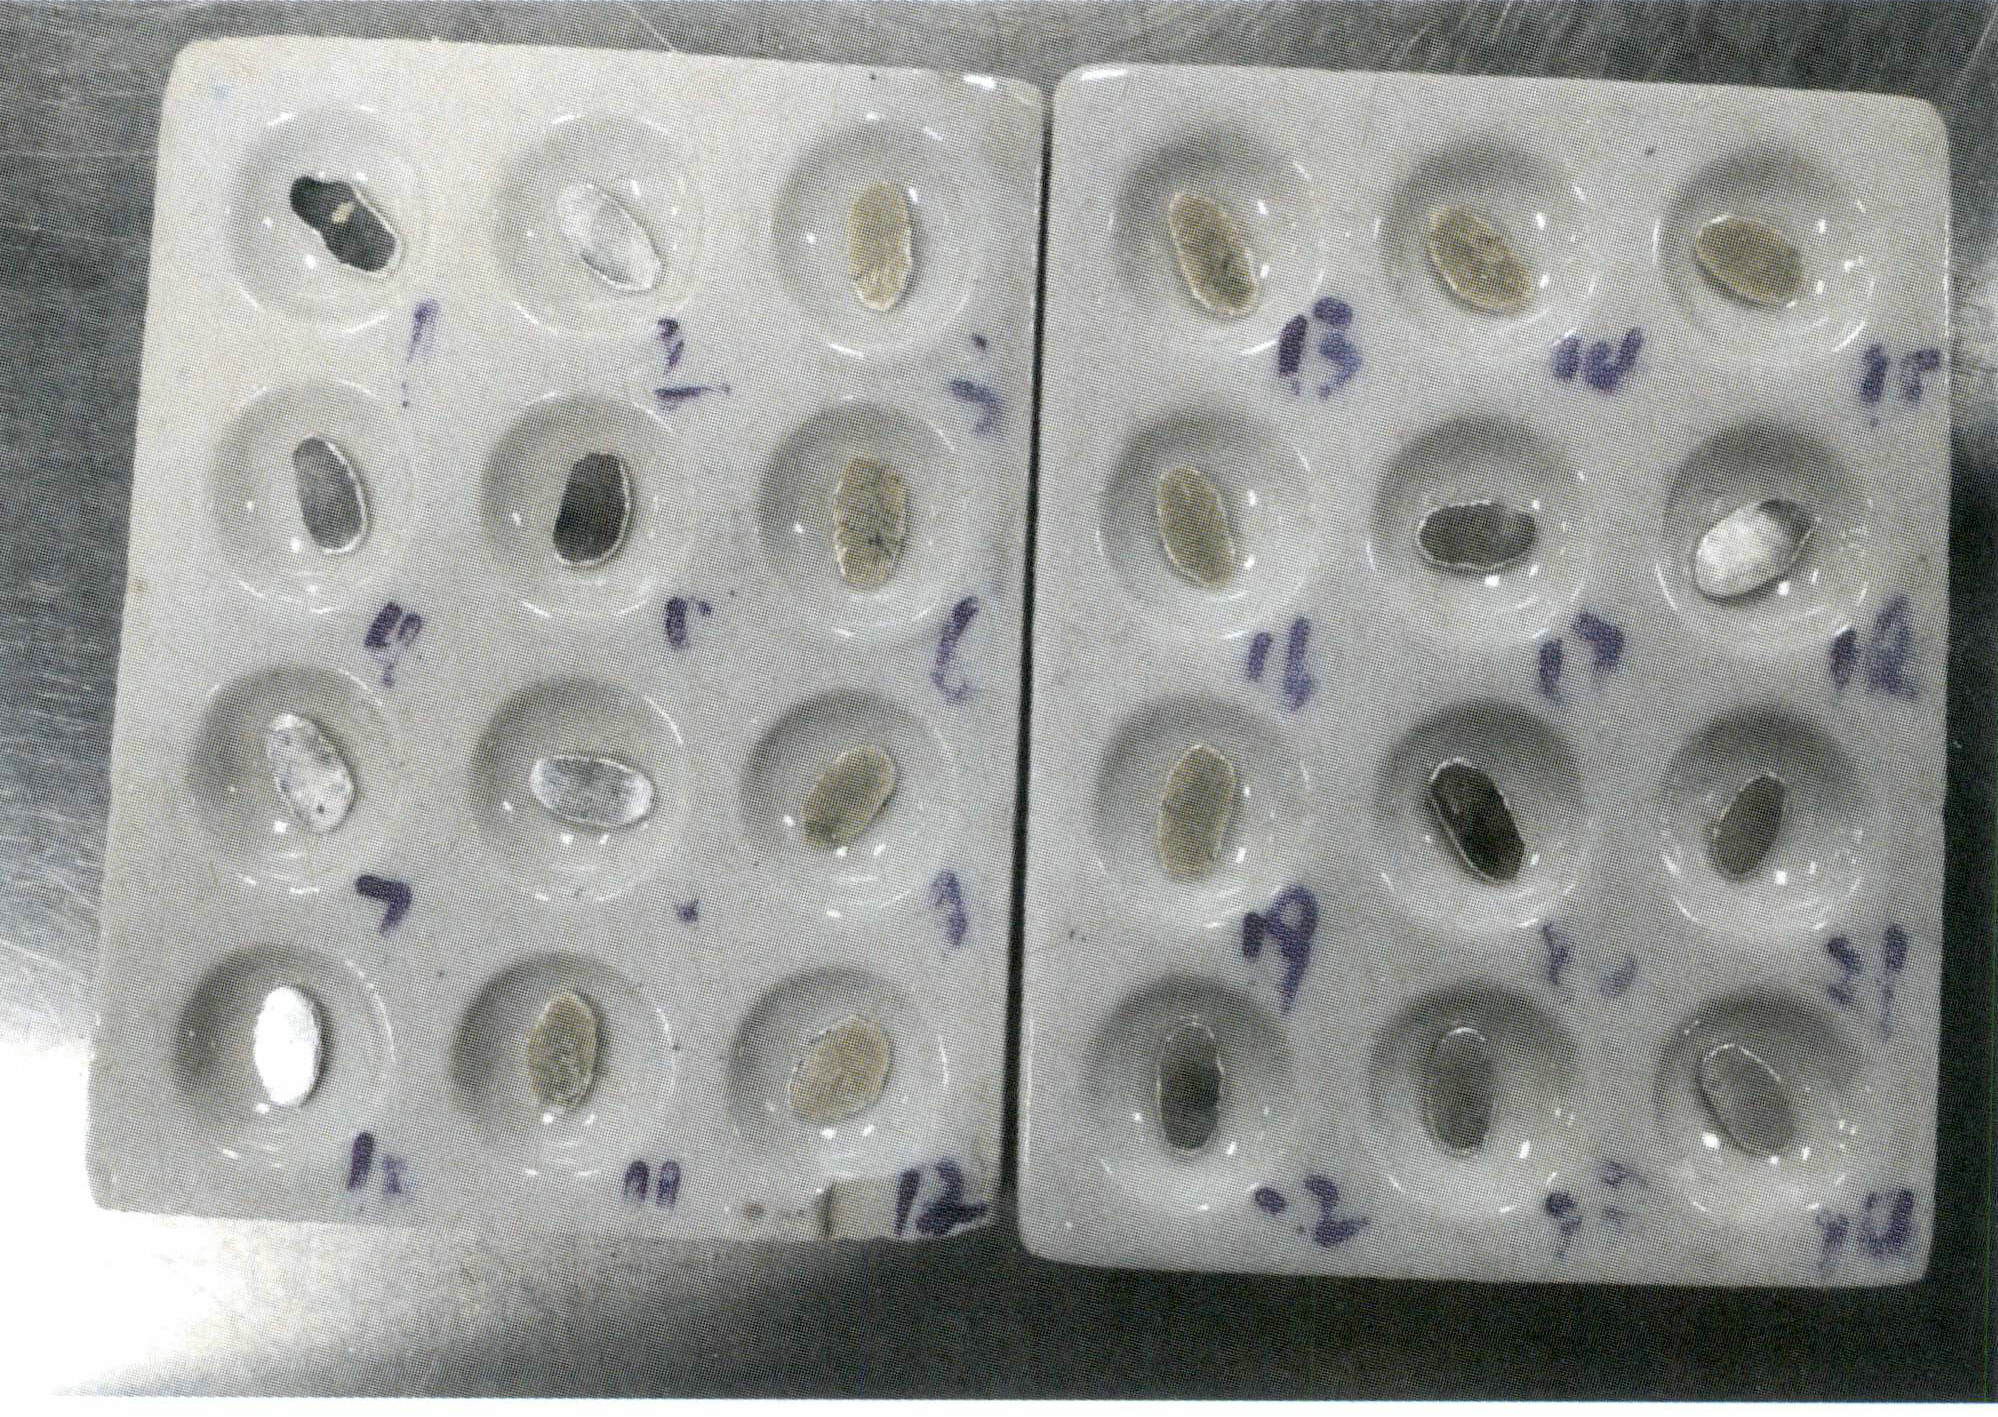
Figure 6-10 Flattening the alloy particles
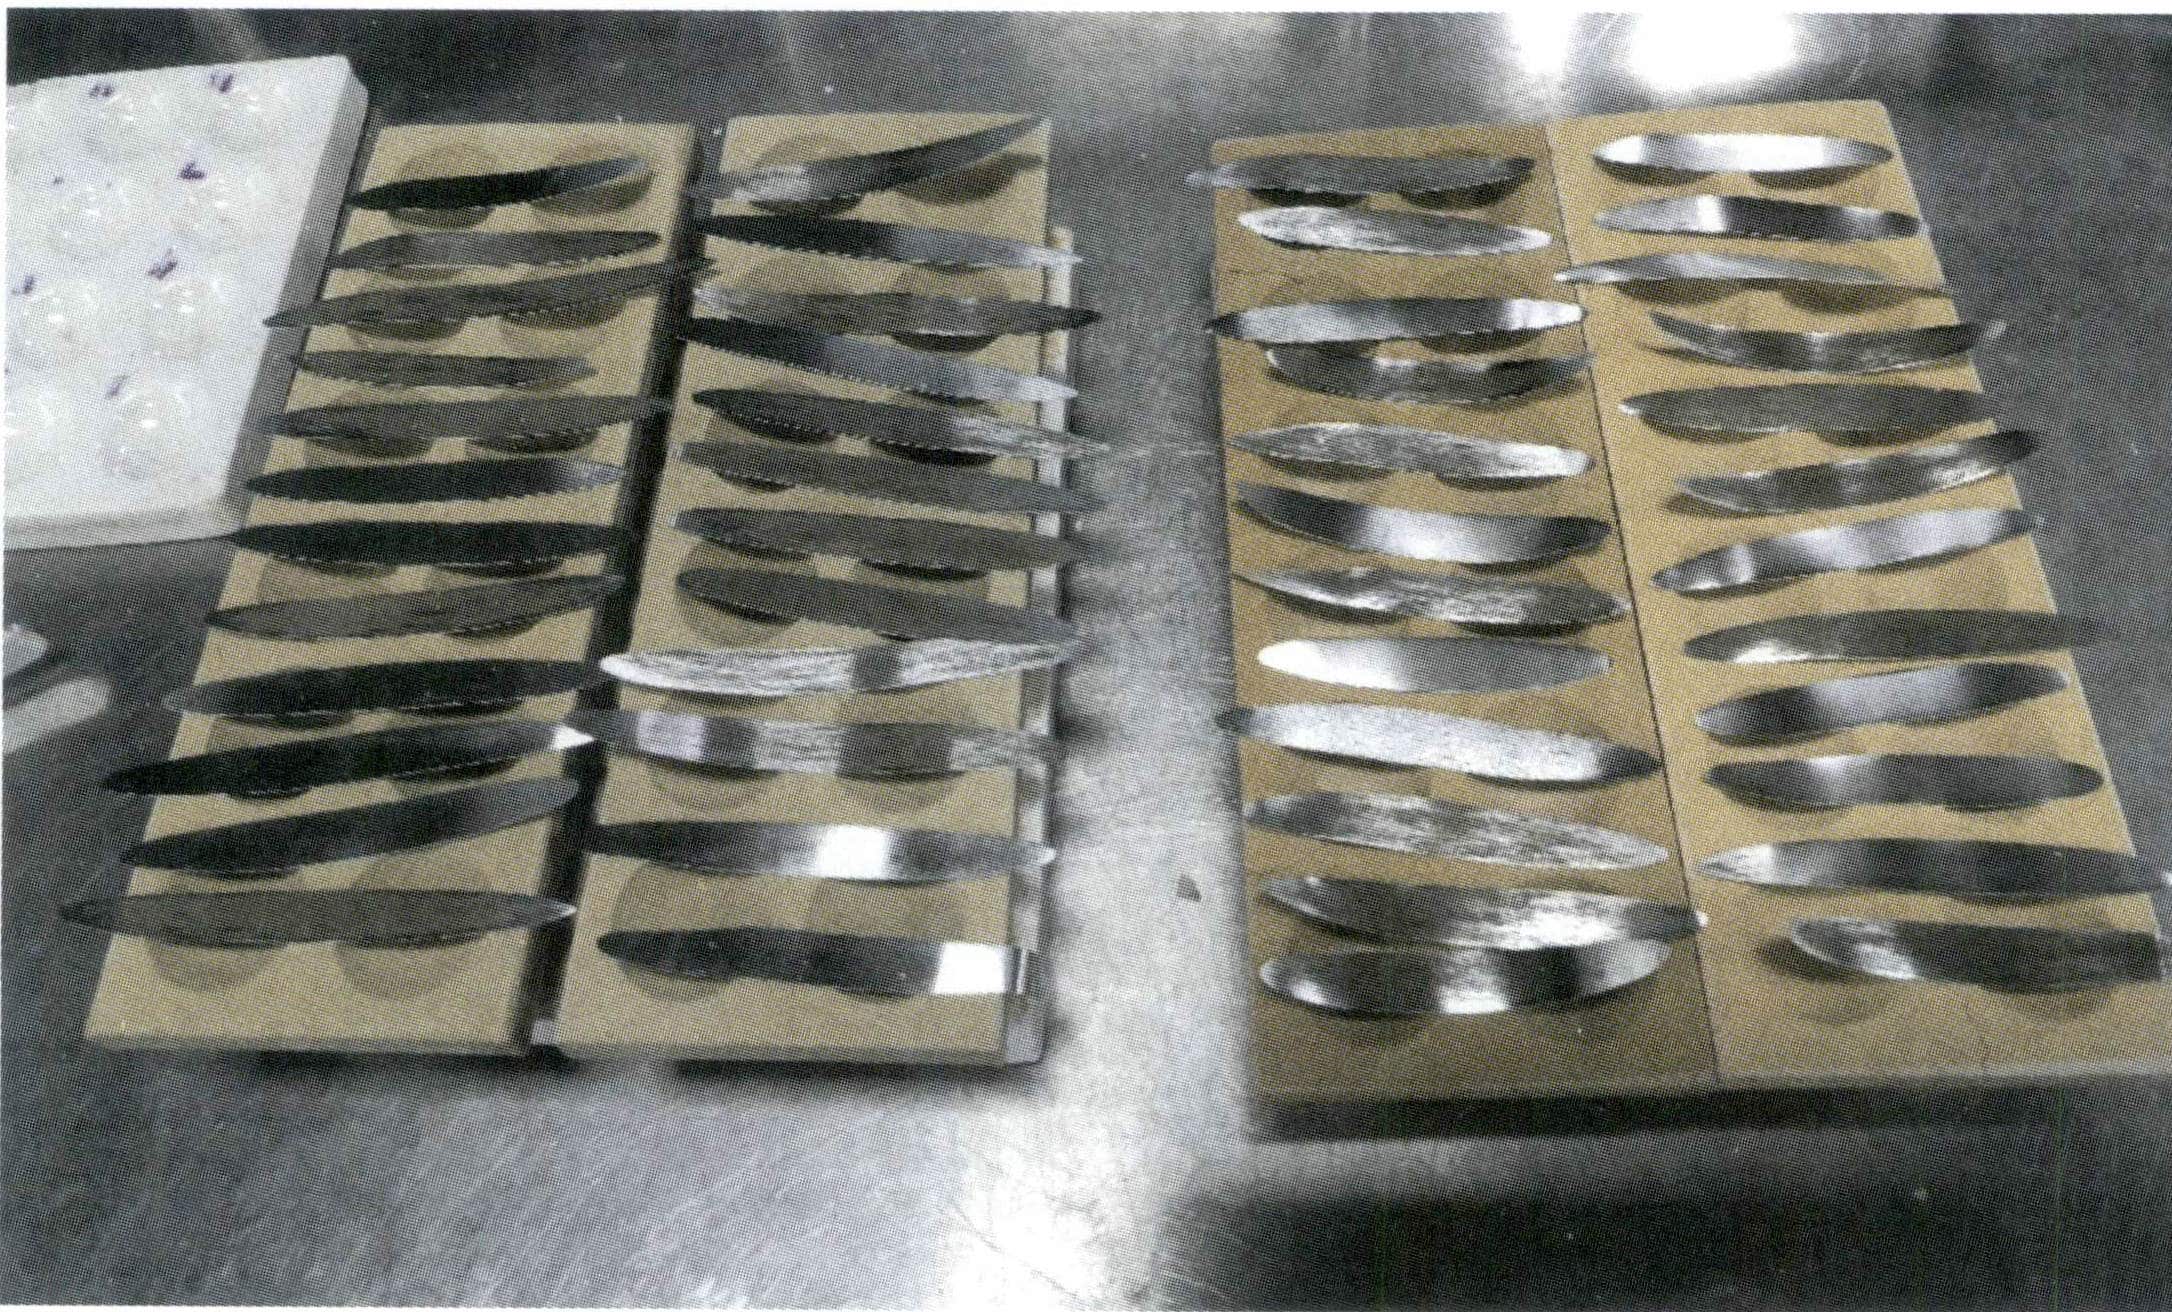
Figure 6-11 Rolling thin sheets

4.7 Gold Separation
Use nitric acid to dissolve silver from the gold alloy roll. Before separating the gold, clean the alloy roll, flask, or basket to prevent contamination or the introduction of chloride ions. Immerse the gold roll in a separation flask containing 20mL of near-boiling nitric acid, keeping it always below the boiling point at a temperature close to boiling, and heat continuously for 15 minutes or until the nitrogen oxide salt mist is driven off, as shown in Figure 6-13. Slowly pour out the solution, wash the gold roll with hot water 3-5 times, and then immerse it in boiling nitric acid and wash it again.

Carefully transfer the standard gold after separation to a porcelain crucible, dry it, and burn it to a golden yellow, as shown in Figure 6-14. After cooling, weigh the mass of the gold roll, which is accurate at 0.01mg.

4.8 Calculation result
Gold content Wt(Au) is calculated according to formula (6-3), with the result rounded to one decimal place:

I formelen:
m1 – sample mass (g);
m2 – a mass of the gold obtained after separating from the sample (g);
m3 – a mass of standard gold (g);
m4 – The quality (g) of the gold ingot obtained after standard gold analysis;
E – The purity of standard gold (‰).
The deviation in results caused by repeated experiments should be less than 0.2‰ for 999.0‰-999.5‰; Gold alloys should be less than 999.0‰ and less than 0.5‰; white K gold should be less than 1‰.
5. Factors Affecting the Accuracy of Fire Assay Analysis
When applying fire assay to analyze gold content, factors such as sample size, type of cupel furnace, material of the cupel, silver to gold ratio, cupellation temperature, and separation time will all affect the results. It is necessary to conduct accompanying experiments using gold standard samples and maintain consistency in the analysis conditions of the gold standard samples and the samples to obtain good parallelism and accurate, reliable results, eliminating systematic errors in the analysis process.
5.1 Sample Size
The sample size for analyzing K gold jewelry is generally small, related to the high content of alloying elements in K gold jewelry. However, a sample size that is too small will directly affect the sample’s representativeness and the analysis’s accuracy. The sample size can be appropriately increased for jewelry with higher purity and lower nickel and copper content for better results. For lower-grade K gold, the amount of lead foil can be appropriately increased to facilitate the separation of impurities. The standard gold appreciation should have a certain range of control and trade-offs to avoid systematic deviations.
5.2 Ash blowing Furnace
A regular muffle furnace can only meet the temperature requirements. It cannot provide the oxidizing gas flow needed during the cupellation process, which reduces the quality and effectiveness of the cupellation. Additionally, it poses certain safety hazards: to provide the oxygen required for oxidation, the furnace door must be opened slightly during the cupellation stage, causing a large amount of lead oxide to escape from the furnace door, resulting in serious lead contamination of the surrounding environment and endangering the health of the operators. Furthermore, prolonged use can lead to corrosion damage of the furnace chamber and opening by lead oxide, and the large amount of lead residue inside the furnace is difficult to discharge in time, which can easily contaminate the analysis samples. Therefore, a dedicated cupellation furnace should be prioritized.
5.3 Ashtray Material
When selecting the material and ratio for ashtrays, it is important to consider not only the ashtray’s ability to absorb impurity elements in the lead but also the recovery rate of gold and silver during the ash-blowing process. Magnesia ashtrays have a relatively high recovery rate, but there are issues with removing adhered particles at the bottom and determining the ash-blowing temperature and endpoint. Bone ash and cement ashtrays make it easier to judge and control the ash-blowing temperature and endpoint, resulting in purer aggregates that are less likely to break when struck into thin sheets. However, the recovery rate is relatively lower.
5.4 Silver to Gold Ratio
Silver has two roles in fire assay: extraction, which extracts gold from impurities, and protection, which reduces gold loss during the measurement process. A small amount of silver can increase gold loss and incomplete oxidation during ash blowing, but more silver is not always better. When the amount of silver added is three times the weight of gold, gold loss increases, and the gold can easily break during separation. Generally, the amount of silver added is related to the sample’s composition. During ash blowing, when nickel and palladium in white K gold alloys are captured, gold can also be lost, so a larger amount of silver is usually required as a protective agent to prevent gold loss. When analyzing gold content using fire assay for white gold alloys containing nickel but not palladium, nickel should be added to the standard gold in quantity roughly equivalent to the sample, and the amount of lead should be increased. For white gold alloys containing palladium, palladium should be added to the standard gold in a quantity roughly equivalent to the sample while increasing the lead amount.
5.5 Ash Blowing Temperature
Taking 18K gold as an example, under the same process conditions, when the ash-blowing temperature is within the 900-1500℃ range, the standard gold loss increases with the rise in ash-blowing temperature and shows a linear distribution. When the ash-blowing temperature is too high, silver is prone to evaporation and splashing, leading to increased errors in the analysis results; when the ash-blowing temperature is too low, the molten lead oxide and impurities may also clump together, which cannot be fully absorbed by the crucible, resulting in the analysis process being unable to proceed.
5.6 Gold Separation Time
Taking 18K white gold as an example, the gold measurement results decrease as the gold separation time increases, but after reaching a certain level, the gold measurement results remain unchanged.
Section VI Inductively Coupled Plasma Emission Spectroscopy (ICP Method)
The inductively coupled plasma emission spectrometer, also known as the ICP spectrometer or ICP atomic emission spectrometer, uses inductively coupled high-frequency plasma as the excitation light source, utilizing the characteristic emission spectra of each element’s atoms or ions to determine the composition of substances and conduct qualitative and quantitative analysis of elements. ICP discharge is a relatively simple and highly effective method that transforms aerosols and vapors of liquids and solids, as well as gases at normal pressure, into free atoms, excited state atoms, and ions or molecular fragments. It can quickly analyze various major, trace, and ultra-trace elements in materials. It is one of the most competitive methods for simultaneous multi-element analysis, characterized by a wide testing range, fast analysis speed, and low detection limits. It has high precision and accuracy for detecting high-content gold and is a commonly used method by jewelry industry testing institutions for determining high-content gold jewelry materials.
1. Principle of the ICP Method
The working principle of the ICP method is shown in Figure 6-15.

The high-frequency power generated by the radio frequency generator is applied to the three-layer concentric quartz torch tube through the induction working coil, forming a high-frequency oscillating electromagnetic field; argon gas is introduced into the outer layer of the quartz torch tube, and high-voltage discharge is performed to generate charged particles. The charged particles move back and forth in the high-frequency electromagnetic field, colliding with other argon ions, producing more charged particles. At the same time, the temperature rises ultimately forming argon plasma, with temperatures reaching 6000-8000 K. The sample of the aqueous solution to be tested is passed through the atomizer. The formed aerosol enters the central channel of the quartz torch tube, where it is fully evaporated, atomized, and ionized in high temperature and inert gas, emitting characteristic spectral lines of the elements contained in the solution; by collecting light from the plasma light source and using a scanning spectrometer for scanning, the light intensity of the characteristic spectral lines of the elements to be tested is accurately positioned at the exit slit. The light intensity of the spectral line is converted into photoelectric current using a photomultiplier tube. After circuit processing and analog-to-digital conversion, it enters the computer for data processing. The presence or absence of characteristic spectral lines identifies whether a certain element is present in the sample (qualitative analysis); based on the intensity of the characteristic spectral lines determines the content of the corresponding element in the sample (quantitative analysis).
2. Advantages and Disadvantages of the ICP Method
2.1 Advantages
(1) Ability to detect multiple elements simultaneously. It can detect multiple elements in the same sample at the same time. Once the sample is excited, each element emits its characteristic spectral lines, allowing for separate detection while simultaneously determining multiple elements.
(2) Fast analysis speed. Most samples can be analyzed without chemical treatment, and solid and liquid samples can be analyzed directly. Additionally, multiple elements can be determined simultaneously. Using a photonic direct-reading spectrometer, the quantitative determination of dozens of elements can be completed within minutes.
(3) Good selectivity. Due to the strong characteristic of the spectrum, it is particularly significant for analyzing elements with very similar chemical properties. For example, analyzing dozens of rare earth elements in Nb and Ta, Zr, and Hf is very difficult compared to other methods. At the same time, emission spectroscopy can easily distinguish and measure them.
(4) Low detection limit. The detection limit of a general light source is (0.1-10) x 10-6, with an absolute value of (0.01-1) 10-6; while using an inductively coupled plasma (ICP) light source, the detection limit can be as low as 10-9 orders of magnitude.
(5) Higher accuracy. The relative error of a general light source is 5% to 10%, while the relative error of ICP can reach below 1%.
(6) The linear range of the ICP light source standard curve is wide, reaching 46 orders of magnitude, allowing for multi-element analysis of a single sample, and can measure different concentrations of high, medium, and low levels.
(7) Low sample consumption, suitable for the multi-component determination of whole batches of samples, especially qualitative analysis, shows unique advantages.
2.2 Disadvantages
The disadvantages of the ICP method are as follows.
(1) Many factors affect the intensity of the spectral lines, such as sample composition, uniformity, sample parallelism, acid concentration, spectral interference, temperature, and humidity, all of which can impact the final detection results. There are high requirements for the components of the standard reference, and most non-metallic elements have difficulty obtaining sensitive spectral lines.
(2) Solid samples generally need to be converted into a solution beforehand, which often worsens the detection limit; the accuracy is poor when the concentration is high.
(3) Not suitable for samples containing impurities such as Ir that are insoluble in aqua regia.
(4) Requires an expensive inductively coupled plasma emission spectrometer, which consumes a large amount of argon during operation, resulting in high detection costs.
3. Instruments and reagents used in the ICP method
3.1 Instruments
Instruments include: Inductively coupled plasma emission spectrometers、Beakers、Volumetric flasks and so on other common laboratory glassware, high-precision electronic balances and etc.
3.2 Reagents
The water used for ICP testing meets the specifications for first-grade water or water of equivalent purity as specified in “Specifications and Test Methods for Water Used in Analytical Laboratories” (GB/T 6682-2008).
The chemical reagents used in ICP testing can be divided into two categories: sample decomposition and preparing standard solutions of elements. All reagents are required to be of analytical grade. When analyzing gold content, a high-purity gold sample with a purity not lower than 99.999% is needed.
4. ICP Analysis Steps
As an example, the steps include the following analysis of gold content in gold jewelry.
4.1 Sample Preparation
After grinding the sample thin, Cut it into small pieces, place them in a beaker, add 20mL of ethanol solution, heat, boil for 5 minutes, then remove it. Pour off the ethanol solution, and wash the gold piece repeatedly with ultrapure water three times. Add 20mL of hydrochloric acid solution, heat, boil for 5 minutes, then remove it. Pour off the hydrochloric acid solution, and wash the gold piece repeatedly with ultrapure water three times. Place the gold piece in a glass weighing bottle, cover it, and put it in the oven to dry at 105℃, then take it out for later use.
4.2 Solution Preparation
(1) Sample Solution. Weigh (1000±2.5)mg sample (accurate to 0.01mg), place it in a 100mL beaker, add 30mL of aqua regia, cover with a watch glass, and slowly heat until completely dissolved, continuing to heat to remove nitrogen oxides. After cooling, transfer the solution to a 50mL volumetric flask, rinse the watch glass and beaker with aqua regia solution, add the wash liquid to the volumetric flask, dilute to the mark, and mix well for later use. Prepare two portions of sample solution for each sample.
(2) Calibration Solution. Weigh three portions of high-purity gold samples with a mass of (1000±2.5)mg (purity > 99.999%), dissolve them to obtain three portions of high-purity gold solution, and prepare the calibration solution according to the following steps.
Calibration Solution 1:
Transfer the first portion of the high-purity gold solution to a 50mL volumetric flask. Rinse the watch glass and beaker with aqua regia solution. Add the wash liquid to the volumetric flask, Dilute to the mark, Mix well. The concentration of the measured impurity elements in Calibration Solution 1 is set to 0/ug/m.
Calibration solution 2:
Transfer the second portion of the high-purity gold solution to a 50mL volumetric flask pre-filled with 5mL of mixed standard solution 1. Rinse the surface dish and beaker with aqua regia solution. Add the wash liquid to the volumetric flask. Dilute to the mark. Shake well.
Calibration solution 3:
Transfer the third portion of the high-purity gold solution to a 50mL volumetric flask pre-filled with 5mL of mixed standard solution 2. Rinse the surface dish and beaker with aqua regia solution. Add the wash liquid to the volumetric flask, Dilute to the mark, Shake well.
4.3 Determination
Adjust the ICP spectrometer to optimal conditions; if testing gold alloy samples, select appropriate analytical lines and background correction according to Table 6-2.
Table 6-2 Recommended wavelengths for impurity elements (analytical lines) (Unit: nm)
| Element | Wavelength | Other available wavelengths | Element | Wavelength | Other available wavelengths |
|---|---|---|---|---|---|
| Ag | 328.068 | 338.289 | Ni | 352.454 | 231.604 |
| Al | 396.152 | 308.215 | Pb | 168.220 | 220.353 |
| Som | 189.042 | 193.696 | Pd | 340.458 | 355.308 |
| Bi | 223.061 | 306.772 | Delt | 306.471 | 203.646 |
| Cd | 226.502 | 228.802 | Rh | 343.489 | - |
| Co | 228.616 | 238.892 | Ru | 240.272 | - |
| Cr | 267.716 | 283.563 | Sb | 206.833 | 217.581 |
| Cu | 324.754 | 327.396 | Se | 196.090 | - |
| Fe | 259.940 | 239.563 | Sn | 189.989 | 189.927 |
| Ir | 215.278 | - | Te | 214.281 | - |
| Mg | 279.553 | 280.270 | Ti | 334.941 | - |
| Mn | 257.610 | 260.569 | Zn | 213. 856 | - |
Measure the impurity element spectral line intensity of calibration solution 1,3, where the concentration of the measured impurity elements in calibration solution one is set to 0/ug/mL, and plot the working curve based on the test results; under the same conditions as the measurement calibration solution, measure the spectral line intensity of impurity elements in two sample solutions and obtain the concentration of each impurity element in the sample solution from the working curve.
4.4 Result Representation
(1) Calculation of the total amount of impurity elements. The total amount of impurity elements in the sample is calculated according to formula (6-4):

I formelen:
ƩA – total amount of impurity elements in the sample (‰);
ƩCi – total concentration of impurity elements in the sample solution ug/mL);
V – volume of the sample solution (mL);
m – Mass of the sample (mg).
(2) Calculation of gold content.
The gold content in the sample is calculated according to formula(6-5):

I formelen:
w(Au) – gold content in the sample (‰);
ƩA – Total amount of impurity elements in the sample (‰).
(3) Reproducibility. The relative deviation of the total impurity elements in two parallel determinations of the samples should be less than 20%; if exceeded, re-determination is required.
5. Factors of Interference in ICP Analysis
During the ICP detection process, interference phenomena are inevitably present, as shown in Figure 6-16. Based on the interference mechanism, it can be divided into two main categories: spectral interference and non-spectral interference. In contrast, according to the state of the interfering factors, it can be divided into gas-phase interference and condensed-phase interference.
Spectral interference and non-spectral interference are effects caused by the components of the sample matrix and accompanying substances, which enhance or weaken the already resolved analytical signals. Non-spectral interference includes sample preparation, spray, solvent removal, volatilization, atomization, excitation, and ionization interference, as shown in Figure 6-16.
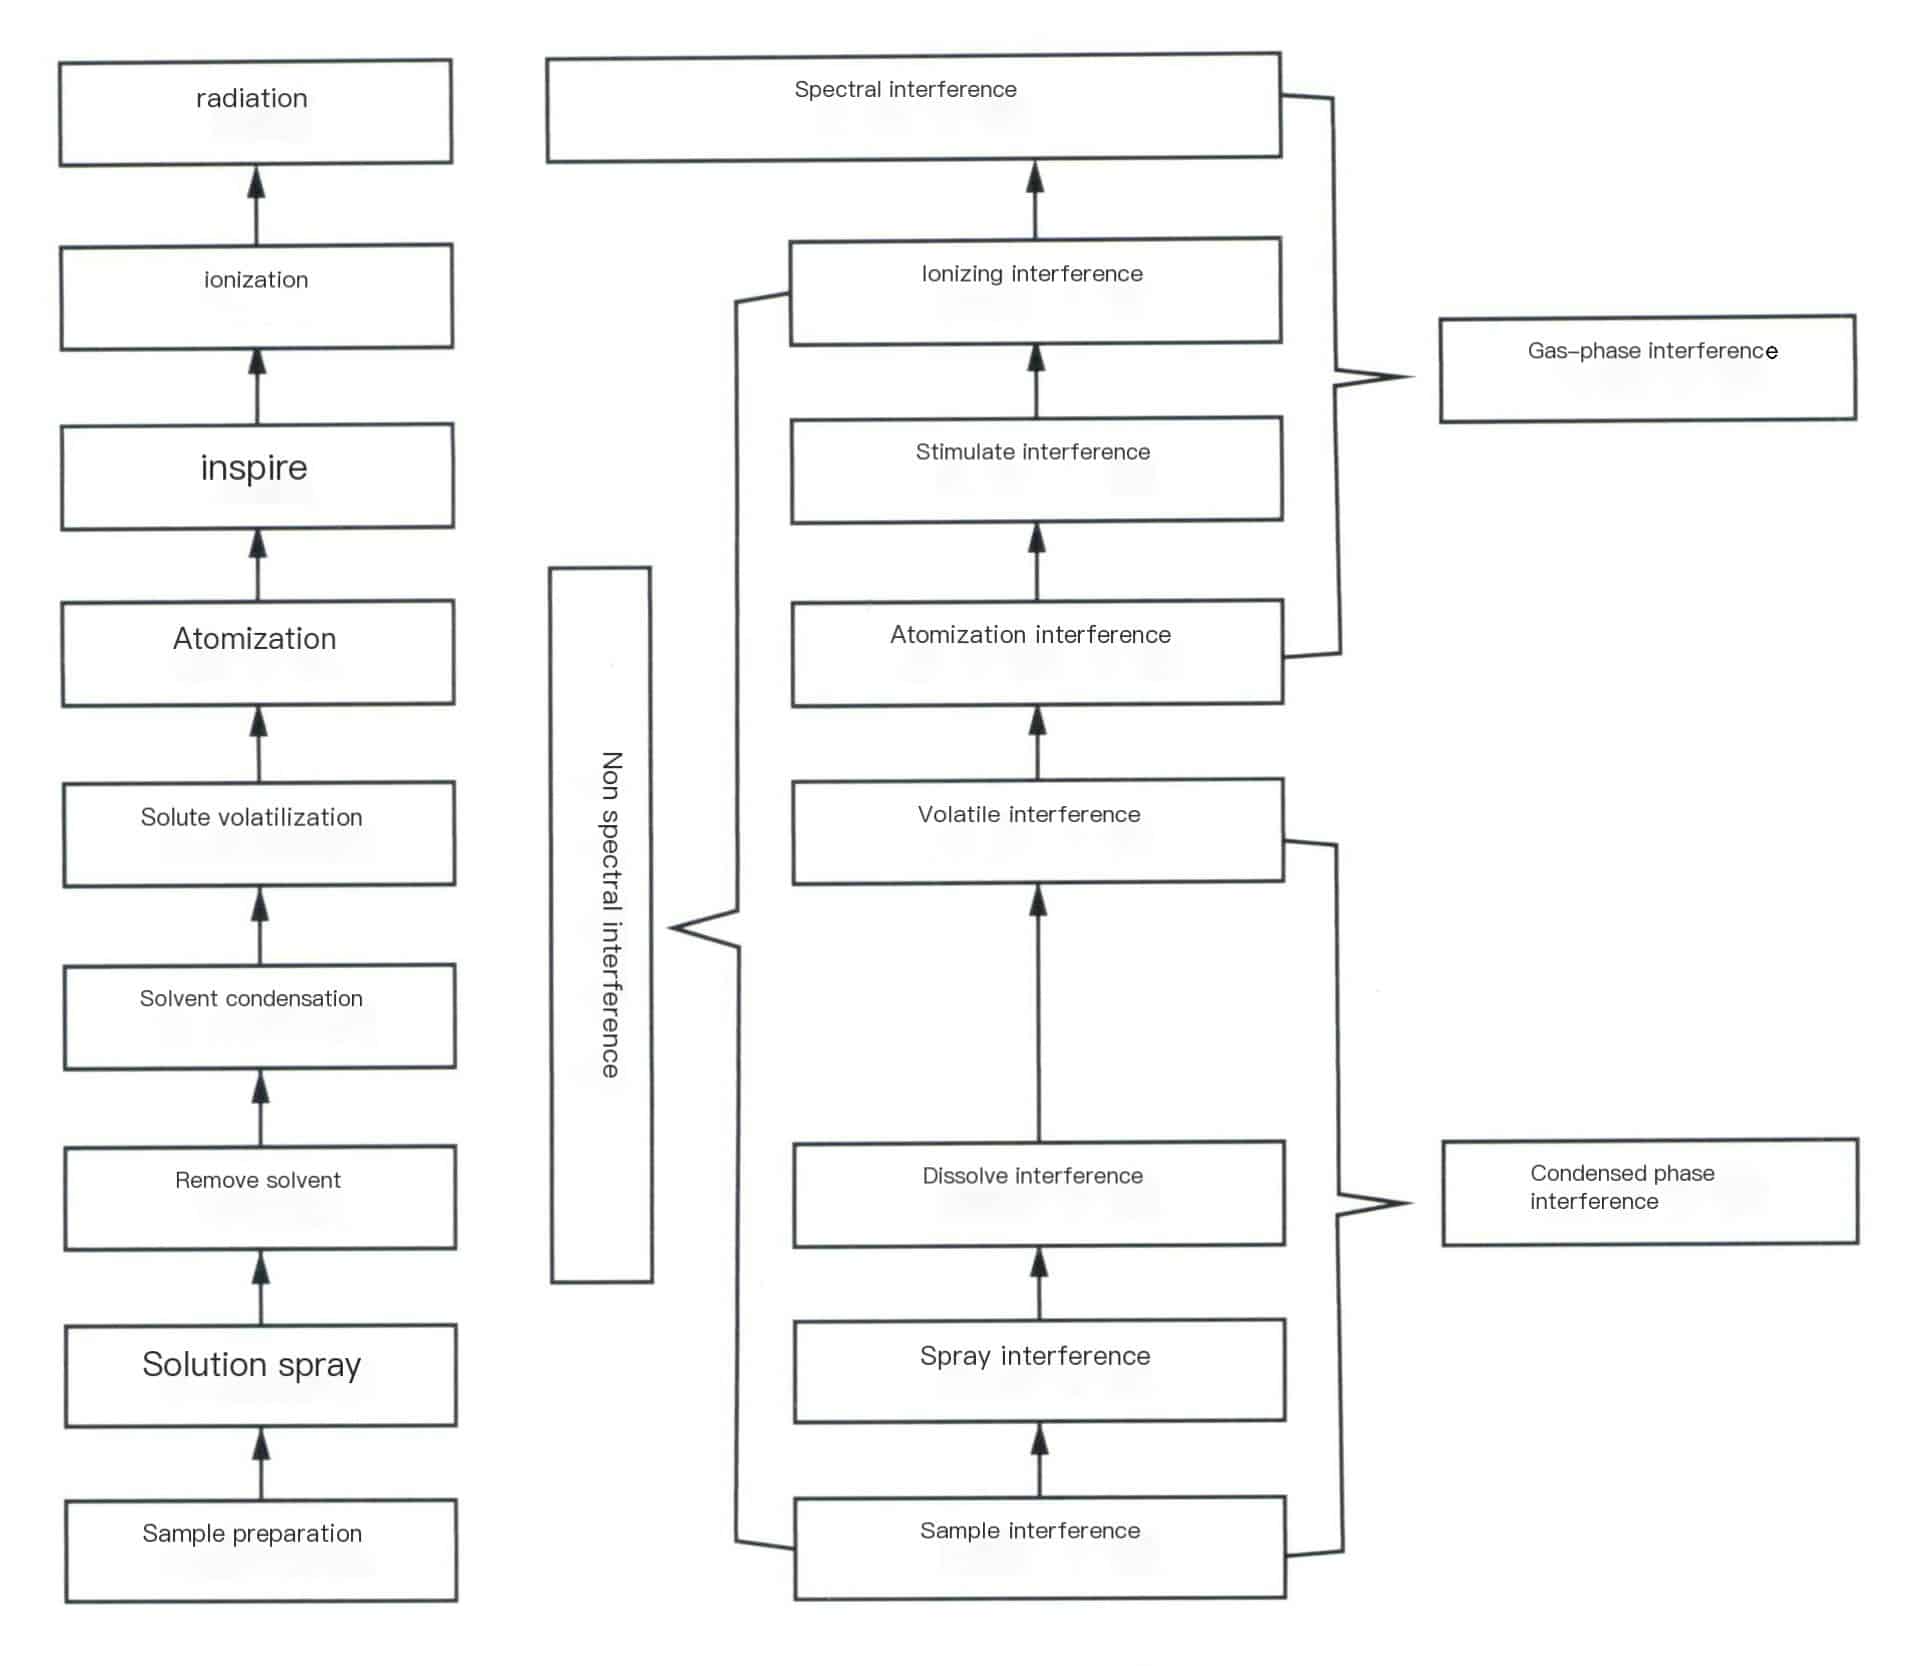
5.1 Spectral Interference
Spectral interference is caused by the inability to resolve the radiation signals generated by the analyte signals and interfering substances. It is the most important and troublesome issue in ICP spectrometry. Due to the strong excitation capability of ICP, almost every substance present in or introduced into ICP emits a considerable number of spectral lines, resulting in a large amount of spectral “interference.”
Spectral interference is mainly divided into two categories: one is line overlap interference, which is caused by the insufficient dispersion and resolution of the spectrometer, leading to the overlap of spectral lines of certain coexisting elements in the analysis; the other is background interference, which is related to the influence of the matrix composition and the strong stray light emitted by the ICP light source itself. Using a high-resolution spectroscopic system for line overlap interference does not mean that this type of spectral interference can be eliminated; it can only be considered that when spectral interference occurs, it can be reduced to minimum intensity. Therefore, the most commonly used method is to select another spectral line with less interference as the analytical line or to apply interference factor correction (IEC) for correction. The most effective method for background interference is to utilize the background correction technology available in modern instruments to deduct it. When interference occurs, they can be reduced to a minimum intensity. Therefore, the most commonly used method is to select another spectral line with less interference as the analytical line or to apply interference factor correction (IEC) for correction. The most effective method for background interference is to utilize the background correction technology available in modern instruments to deduct it.
5.2 Non-spectral interference
(1) Interference from physical factors.
Since the samples for ICP spectral analysis are in solution form, factors such as the viscosity, relative density, and surface tension of the solution all affect the atomization process, droplet size, aerosol transport, and solvent evaporation, and viscosity is related to the composition of the solution, the concentration and type of acid, and temperature.
When the solution contains organic solvents, both dynamic viscosity and surface tension will decrease, improving atomization efficiency. At the same time, most organic reagents are flammable, thus increasing the tail flame’s temperature and increasing spectral line intensity. At this time, the power of the ICP needs to be appropriately increased to suppress the intensity of the molecular spectrum of carbides in the organic reagents.
As seen above, the interference of physical factors exists and should be avoided. The main method is to ensure that the standard test solution and the sample to be tested are completely consistent regarding the composition of matrix elements, total salinity, concentration of organic solvents, and acids. Currently, the peristaltic pump sampling system used can help reduce the aforementioned physical interference. Additionally, internal standard correction can appropriately compensate for the effects of physical interference. Matrix matching or standard addition methods can effectively eliminate physical interference but require a larger workload.
(2) Ionization interference.
Since the sample in the ICP is evaporated, dissociated, ionized, and excited in the channel, the changes in sample composition have little effect on the electrical parameters of the high-frequency skin effect. Therefore, the influence of easily ionizable elements on the intensity of ion lines and atomic lines is smaller than that of other light sources. However, experiments show that this easily ionizable interference effect still has a certain impact on spectral analysis.
For vertically observed ICP light sources, appropriately selecting the plasma parameters can minimize ionization interference.
However, for horizontally observed ICP light sources, this easily ionizable interference is relatively more severe. The currently used bidirectional observation technology can effectively address this easily ionizable interference. It is also necessary to maintain a similar composition between the sample solution to be tested and the analytical standard solution.
(3) Matrix effect interference.
The matrix effect originates from the plasma, and for any analytical line, this effect is related to the excitation potential of the spectral line. However, due to the good detection capability of ICP, the analytical solution can be appropriately diluted to keep the total salt content around 1mg/mL. In this diluted solution, matrix interference is often negligible. When the concentration of the matrix substance reaches several milligrams per milliliter, the matrix effect cannot be completely ignored. The matrix effect of the ICP light source is slightly more severe when observed horizontally. Matrix matching, separation techniques, or standard addition methods can eliminate or suppress the matrix effect.
Copywrite @ Sobling.jewelry - Tilpasset smykkeprodusent, OEM og ODM smykkefabrikk


